Industrial Properties
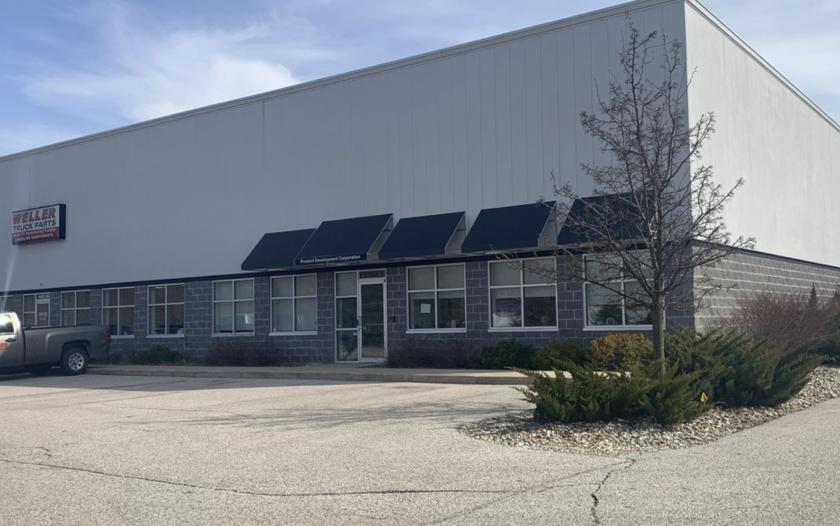
3303 William Richardson Court South Bend, IN 46628
3303 William Richardson Court South Bend, IN 46628
Details & Description
Property Highlights
• Proximal to South Bend International Airport and near large scale industrial development on the NW side of town
• Excellent for warehouse, distribution, light industrial, or service oriented users
Listing Agents

Jeremy McClements
O: 574-970-9004
M: 574-876-9535
jmcclements@bradleyco.com
O: 574-970-9004
M: 574-876-9535
jmcclements@bradleyco.com
While we strive to provide the most accurate information, all listing information, and demographic data, is provided by third-parties. As such, MyEListing will not be responsible for the accuracy of the information. It is strongly recommended that you verify all information with the listing agent, and any relevant agencies, prior to making any decisions.


