Retail Space
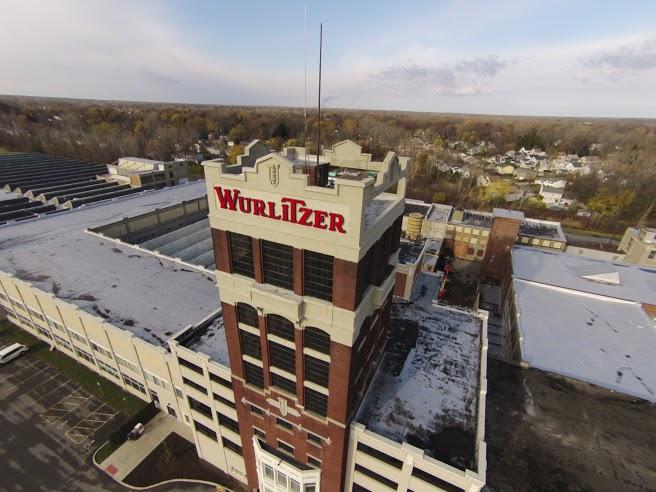
908 Niagara Falls Boulevard North Tonawanda, NY 14120
908 Niagara Falls Boulevard North Tonawanda, NY 14120
Details & Description
Property Highlights
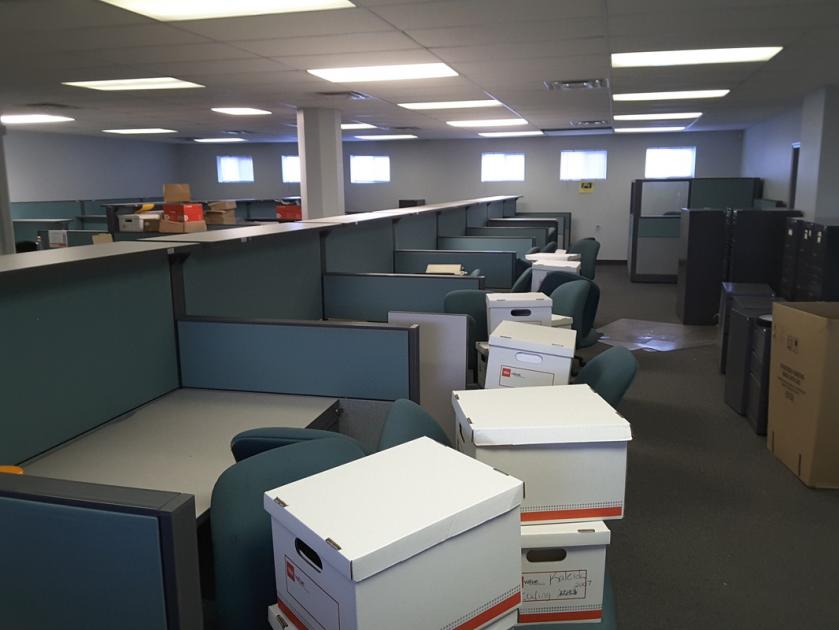
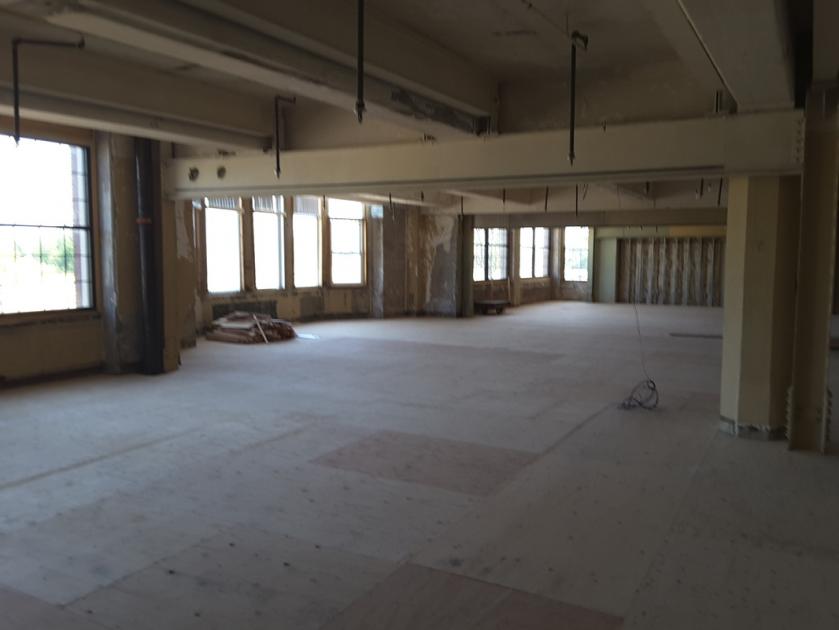
• 300 to 50,000 sq. ft. retail, office, and warehouse space available
• Located 20 minutes from the Canadian Bridges and Downtown Buffalo
Listing Agents

Carl R. Buzak Jr
O: 716-856-2872
carl@militello.com
O: 716-856-2872
carl@militello.com
While we strive to provide the most accurate information, all listing information, and demographic data, is provided by third-parties. As such, MyEListing will not be responsible for the accuracy of the information. It is strongly recommended that you verify all information with the listing agent, and any relevant agencies, prior to making any decisions.