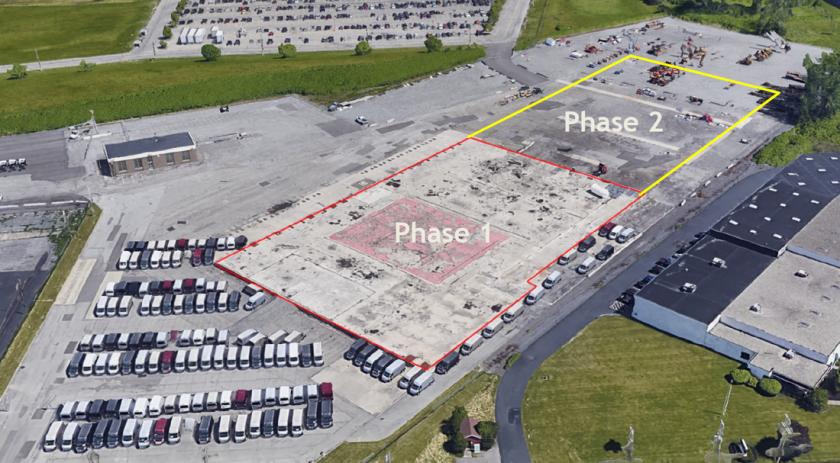
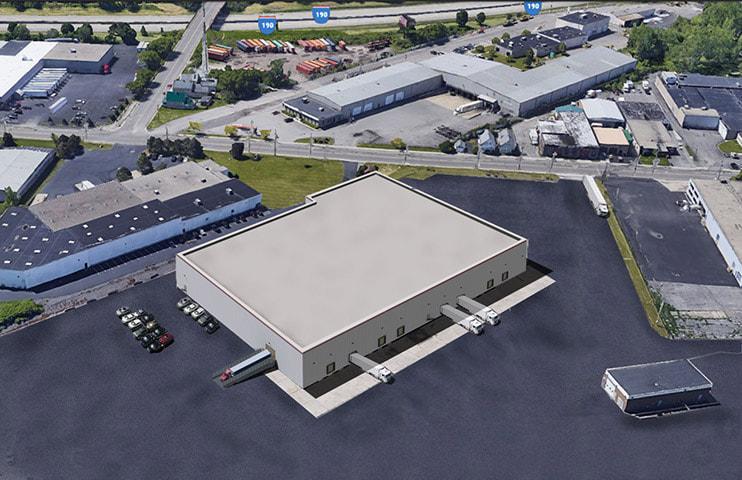
1-Mile | 3-Miles | 5-Miles | ||
---|---|---|---|---|
Total Population | 13,518 | 116,864 | 307,350 | |
Population Median Age | 39 | 39 | 39 | |
Population by Age | 0-9 Yrs | 1477 (10%) | 14597 (12%) | 36436 (11%) |
10-19 Yrs | 1685 (12%) | 14070 (12%) | 35817 (11%) | |
20-29 Yrs | 1789 (13%) | 16854 (14%) | 52023 (16%) | |
30-39 Yrs | 2053 (15%) | 16309 (13%) | 42298 (13%) | |
40-49 Yrs | 1570 (11%) | 13079 (11%) | 33252 (10%) | |
50-59 Yrs | 2001 (14%) | 16868 (14%) | 41232 (13%) | |
60-69 Yrs | 1620 (11%) | 13403 (11%) | 34461 (11%) | |
70+ Yrs | 1323 (9%) | 11683 (9%) | 31830 (10%) | |
Median HH Income | $41,097 | $37,831 | $42,404 | |
Total Household Income | < 24K | 1775 (30%) | 17792 (34%) | 42374 (31%) |
25-49K | 1709 (29%) | 13476 (26%) | 34423 (25%) | |
50-74K | 1131 (19%) | 8604 (16%) | 23675 (17%) | |
75-99K | 634 (10%) | 5443 (10%) | 14835 (10%) | |
100-199K | 556 (9%) | 5475 (10%) | 17598 (12%) | |
200K+ | 71 (1%) | 508 (0%) | 3001 (2%) | |
Highest Education Level | No Diploma | 1537 | 11878 | 27073 |
Diploma or GED | 3752 | 28697 | 65594 | |
Some College | 1869 | 16762 | 42171 | |
Assoc. Degree | 960 | 9195 | 23719 | |
Bachelors Degree | 1009 | 9470 | 31352 | |
Higher Degree | 483 | 4700 | 21530 | |
Total Housing Units | 6,912 | 61,137 | 156,948 | |
--Owner-Occupied | 3,395 | 26,730 | 67,483 | |
--Renter-Occupied | 2,481 | 24,568 | 68,423 | |
Owner-Occupied Values | < 100K | 2792 | 16782 | 31895 |
100-199K | 465 | 8333 | 25579 | |
200-299K | 7 | 764 | 4693 | |
300-399K | 21 | 219 | 2127 | |
400-499K | 15 | 90 | 1095 | |
500K+ | 94 | 541 | 2094 | |
Total Working Age Population | 11,098 | 93,446 | 249,809 | |
In Work Force | 7,000 | 56,444 | 153,513 | |
Not In Work Force | 4,099 | 37,002 | 96,296 | |
Workforce Employed | 6,561 | 51,956 | 143,620 | |
Workforce Unemployed | 423 | 4,456 | 9,689 | |
Civlian Workforce | 6,985 | 56,412 | 153,309 | |
Military Workforce | 15 | 33 | 204 | |
Total Households | 5,876 | 51,298 | 135,906 | |
Family Households | 3,375 | 28,140 | 71,541 | |
Non-Family Households | 2,501 | 23,158 | 64,365 | |
Married Couple | 1,935 | 14,751 | 39,276 | |
Other Family | 1,440 | 13,390 | 32,265 | |
Married w/Child | 632 | 5,284 | 14,223 | |
Single Male w/Child | 183 | 1,344 | 3,018 | |
Single Female w/Child | 587 | 5,662 | 14,153 |
Population Change Last Two Decades - Plus Projection
2000 | % | 2010 | % | 2020 | % | 2030 | |
---|---|---|---|---|---|---|---|
New York | 18,976,457 | +2 | 19,378,102 | +4 | 20,146,131 | +2 | 20,604,030 |
Erie County | 950,265 | -3 | 919,040 | +2 | 936,084 | +1 | 949,073 |
Total Working Age Population:
Total Households:
Total Working Age Population:
Total Households:
Total Working Age Population:
Total Households: