Retail Space
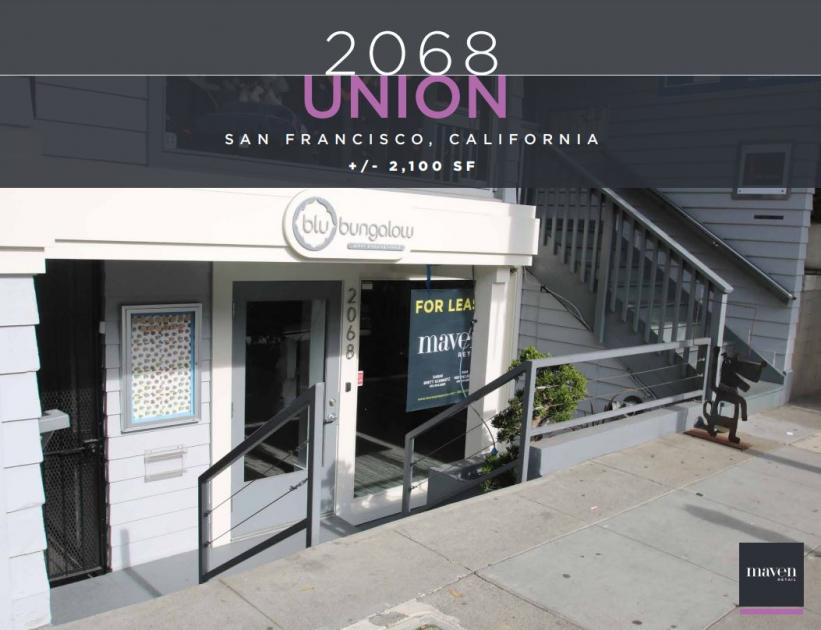
2068 Union Street San Francisco, CA 94123
2068 Union Street San Francisco, CA 94123
Details & Description
Property Highlights
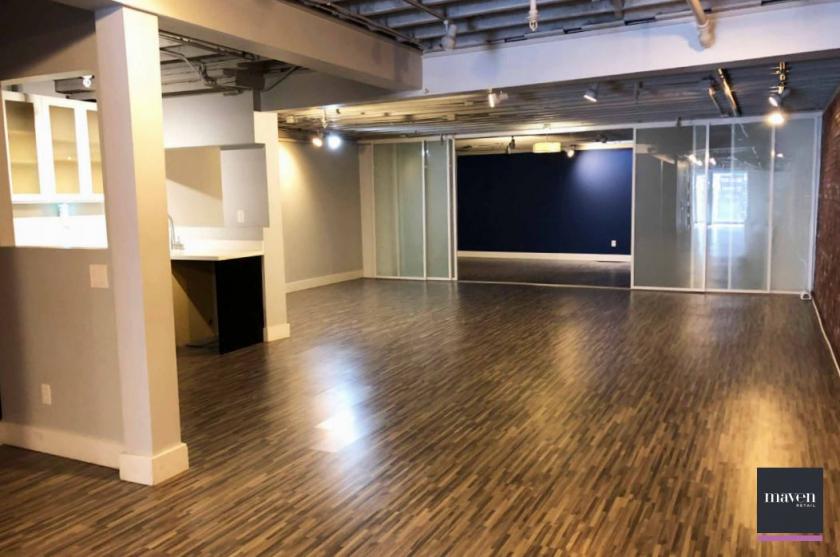
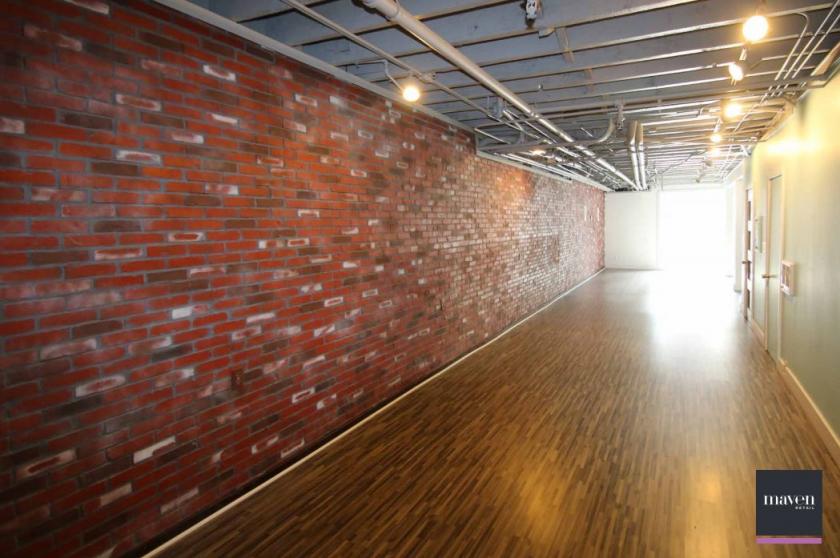
• Space includes large open area, storage, kitchenette, and rear showroom
• Nearby neighbors include Flores, Equinox, Nike, Belga, and more
Listing Agents

Sarah BrettSchwartz
O: 415-404-6959
M: 415-310-5313
sarah@mavenproperties.com
O: 415-404-6959
M: 415-310-5313
sarah@mavenproperties.com
While we strive to provide the most accurate information, all listing information, and demographic data, is provided by third-parties. As such, MyEListing will not be responsible for the accuracy of the information. It is strongly recommended that you verify all information with the listing agent, and any relevant agencies, prior to making any decisions.