Commercial Land
1500 South Western Avenue Marion, IN 46953
1500 South Western Avenue Marion, IN 46953
Details & Description
Property Highlights
- • Outlot available - 0.75 Acres
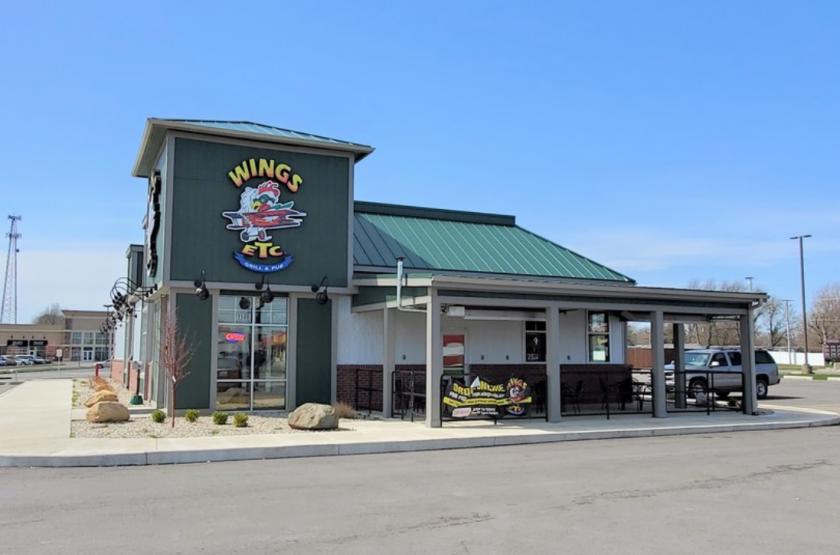
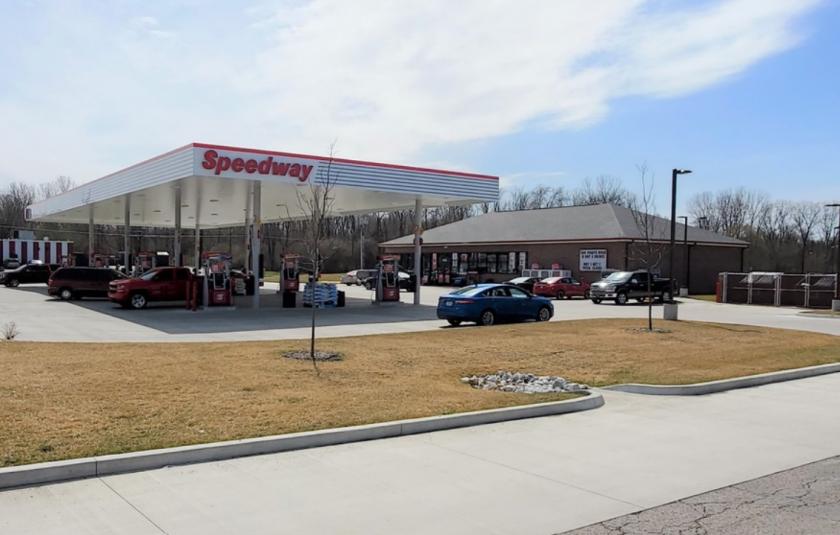
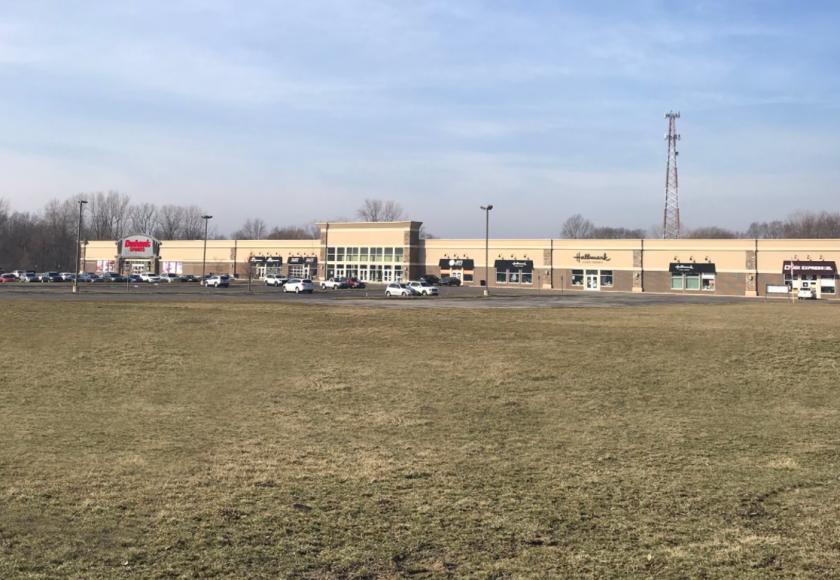
- • Located in Marions major retail corridor
- • Additional Parking is negotiable
Listing Agents

Stanley Phillips
O: 260-423-4311
sphillips@bradleyco.com
O: 260-423-4311
sphillips@bradleyco.com
While we strive to provide the most accurate information, all listing information, and demographic data, is provided by third-parties. As such, MyEListing will not be responsible for the accuracy of the information. It is strongly recommended that you verify all information with the listing agent, and any relevant agencies, prior to making any decisions.