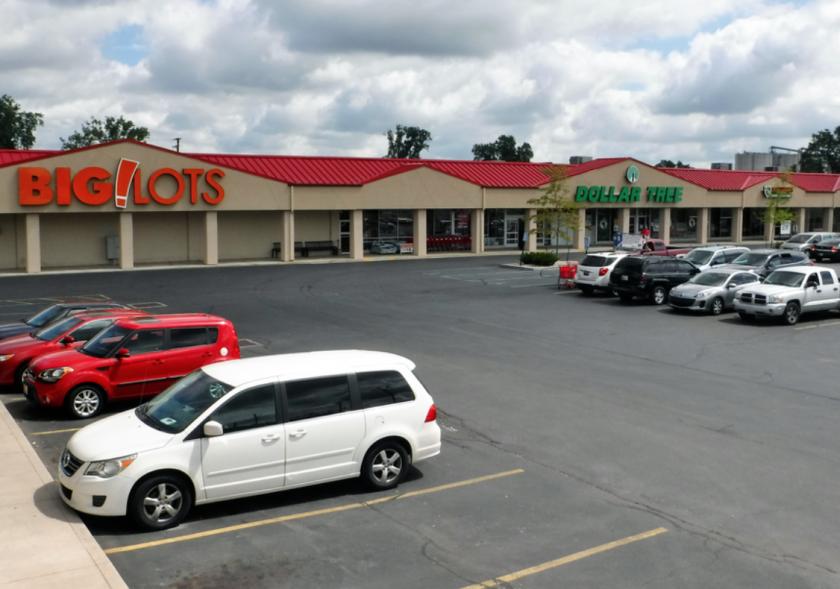
1-Mile | 3-Miles | 5-Miles | ||
---|---|---|---|---|
Total Population | 4,084 | 34,442 | 112,648 | |
Population Median Age | 39 | 39 | 37 | |
Population by Age | 0-9 Yrs | 556 (13%) | 4831 (14%) | 16653 (14%) |
10-19 Yrs | 501 (12%) | 4747 (13%) | 17301 (15%) | |
20-29 Yrs | 530 (12%) | 4333 (12%) | 15852 (14%) | |
30-39 Yrs | 480 (11%) | 4037 (11%) | 14015 (12%) | |
40-49 Yrs | 456 (11%) | 4522 (13%) | 13216 (11%) | |
50-59 Yrs | 700 (17%) | 4042 (11%) | 12678 (11%) | |
60-69 Yrs | 528 (12%) | 3725 (10%) | 11495 (10%) | |
70+ Yrs | 332 (8%) | 4206 (12%) | 11439 (10%) | |
Median HH Income | $45,376 | $51,480 | $47,273 | |
Total Household Income | < 24K | 364 (22%) | 2542 (18%) | 10665 (25%) |
25-49K | 498 (30%) | 3960 (29%) | 11871 (27%) | |
50-74K | 334 (20%) | 2640 (19%) | 8292 (19%) | |
75-99K | 254 (15%) | 2101 (15%) | 5267 (12%) | |
100-199K | 157 (9%) | 1989 (14%) | 5580 (13%) | |
200K+ | 12 (0%) | 155 (1%) | 952 (2%) | |
Highest Education Level | No Diploma | 386 | 2504 | 9243 |
Diploma or GED | 1061 | 7357 | 21369 | |
Some College | 648 | 5495 | 16694 | |
Assoc. Degree | 315 | 2403 | 7226 | |
Bachelors Degree | 295 | 3767 | 11099 | |
Higher Degree | 79 | 1385 | 5096 | |
Total Housing Units | 1,770 | 14,569 | 47,642 | |
--Owner-Occupied | 1,195 | 9,879 | 28,279 | |
--Renter-Occupied | 424 | 3,508 | 14,348 | |
Owner-Occupied Values | < 100K | 842 | 4058 | 13273 |
100-199K | 271 | 4927 | 12584 | |
200-299K | 61 | 774 | 1826 | |
300-399K | 9 | 55 | 309 | |
400-499K | 6 | 28 | 97 | |
500K+ | 6 | 37 | 189 | |
Total Working Age Population | 3,251 | 26,472 | 85,269 | |
In Work Force | 2,138 | 17,190 | 54,904 | |
Not In Work Force | 1,114 | 9,283 | 30,365 | |
Workforce Employed | 1,951 | 16,104 | 51,079 | |
Workforce Unemployed | 184 | 1,080 | 3,784 | |
Civlian Workforce | 2,135 | 17,183 | 54,863 | |
Military Workforce | 3 | 6 | 41 | |
Total Households | 1,619 | 13,387 | 42,627 | |
Family Households | 1,108 | 8,834 | 27,544 | |
Non-Family Households | 511 | 4,553 | 15,083 | |
Married Couple | 852 | 6,627 | 18,329 | |
Other Family | 255 | 2,207 | 9,215 | |
Married w/Child | 304 | 2,680 | 7,703 | |
Single Male w/Child | 36 | 351 | 1,150 | |
Single Female w/Child | 101 | 971 | 4,421 |
Population Change Last Two Decades - Plus Projection
2000 | % | 2010 | % | 2020 | % | 2030 | |
---|---|---|---|---|---|---|---|
Indiana | 6,080,485 | +7 | 6,483,802 | +4 | 6,738,573 | +4 | 7,014,880 |
Allen County | 331,849 | +7 | 355,329 | +7 | 379,671 | +6 | 402,948 |
Total Working Age Population:
Total Households:
Total Working Age Population:
Total Households:
Total Working Age Population:
Total Households: