Retail Space
2880 Walmart Drive Huntington, IN 46750
2880 Walmart Drive Huntington, IN 46750
Details & Description
Property Highlights
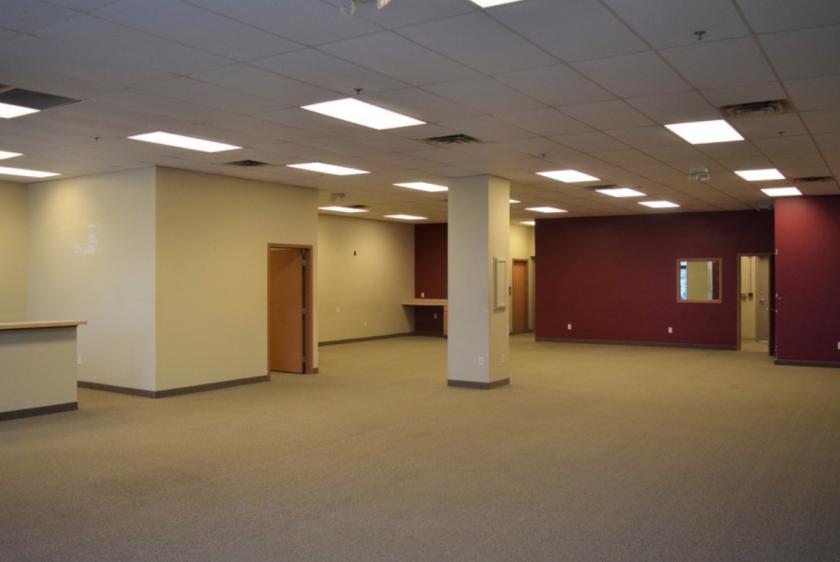
- • Only one suite available - 1,400 SF
- • Adjacent to the new Walmart Supercenter
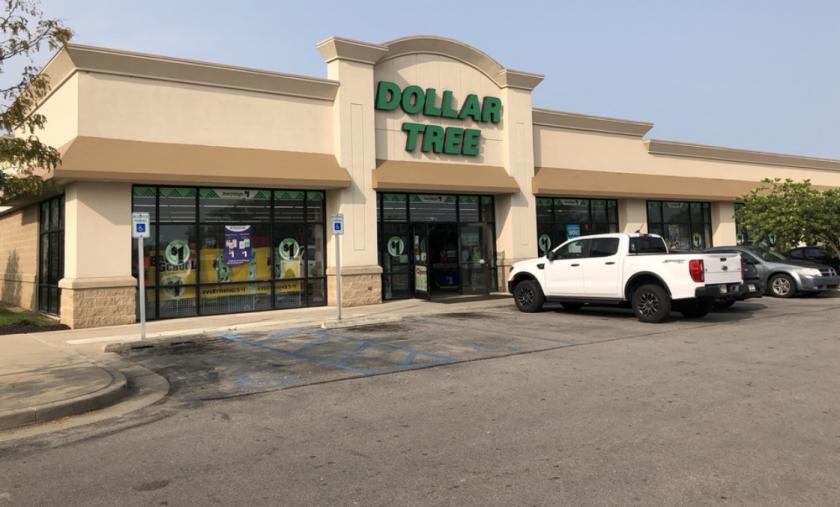
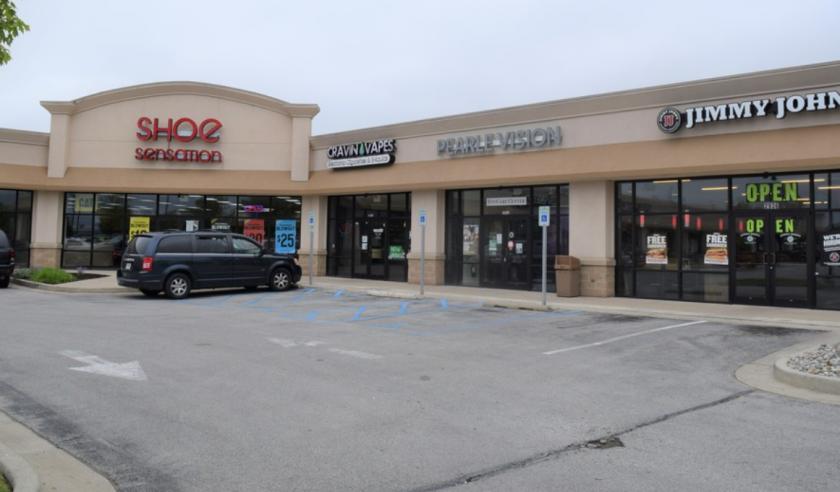
- • Well maintained center
- • Newest neighborhood center in the city
- • Close to higher-end residential communities
Listing Agents

Stanley Phillips
O: 260-423-4311
sphillips@bradleyco.com
O: 260-423-4311
sphillips@bradleyco.com
While we strive to provide the most accurate information, all listing information, and demographic data, is provided by third-parties. As such, MyEListing will not be responsible for the accuracy of the information. It is strongly recommended that you verify all information with the listing agent, and any relevant agencies, prior to making any decisions.