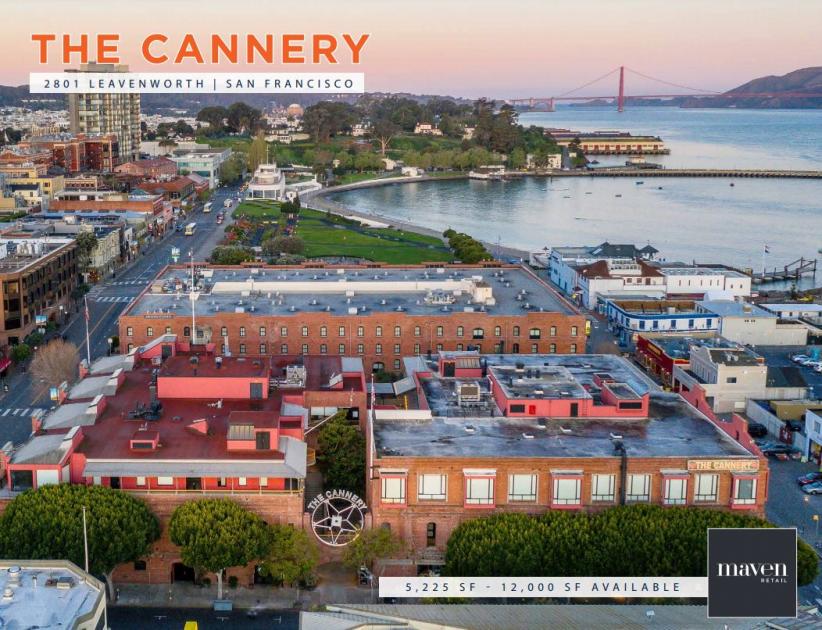
Retail Space
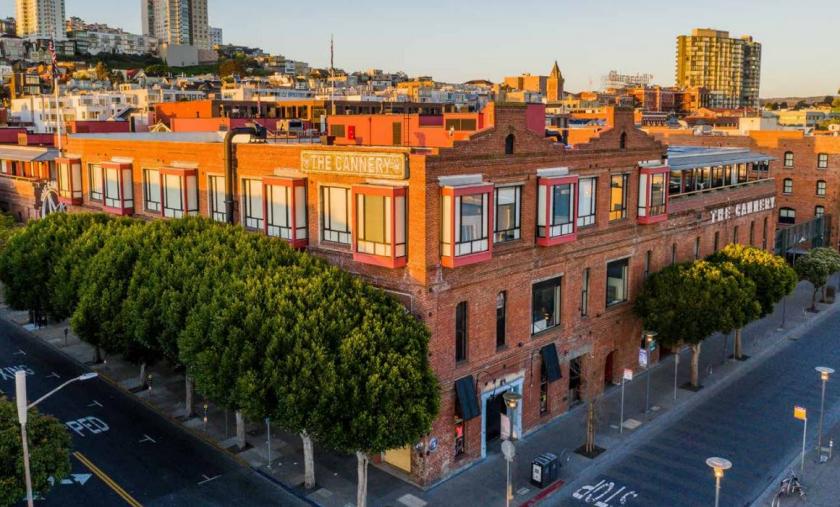
2801 Leavenworth Street San Francisco, CA 94133
2801 Leavenworth Street San Francisco, CA 94133
Details & Description
Property Highlights
- • Space A 5,970 - 12,000 SF
- • Excellent Visibility and Signage
- • Hard Corner Location
- • Space B 5,225 SF
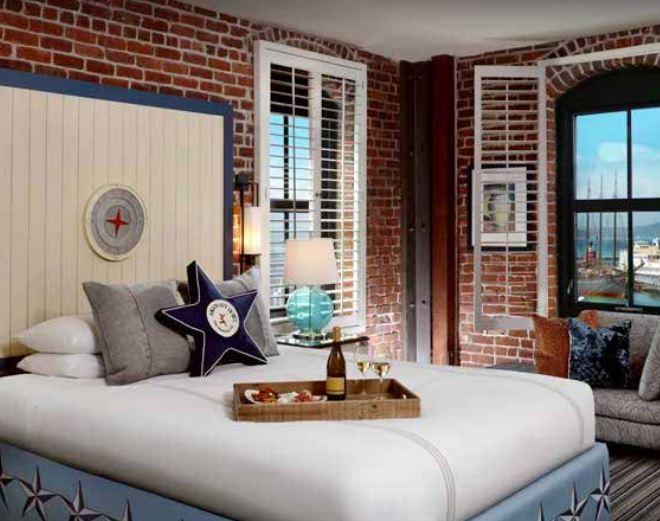
- • 400-Year Old Oak Interior
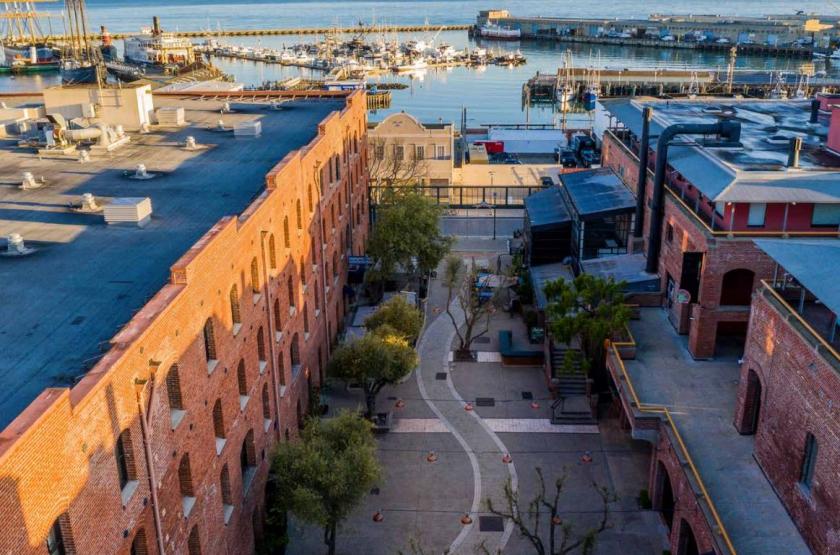
- • Outdoor Communal Courtyard Seating with Bar
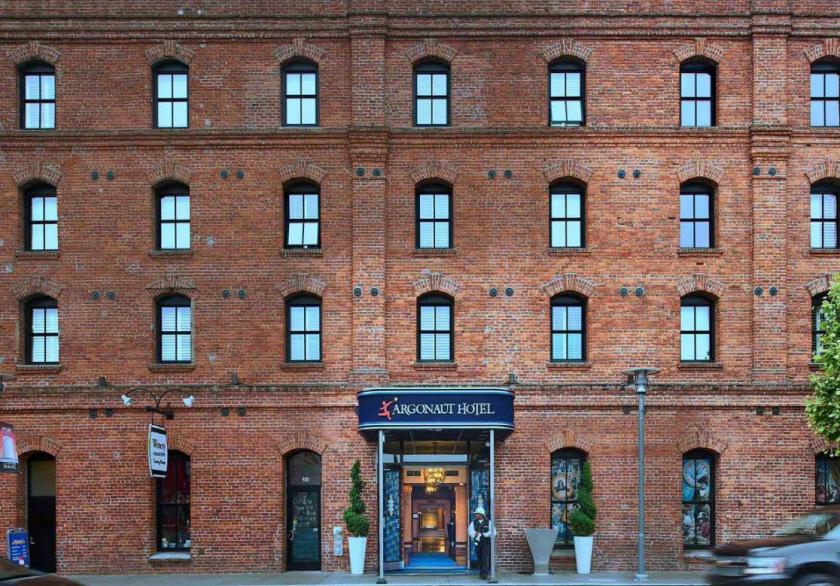
Additional Photos
Listing Agents

Jacklyn Arzio
O: 510-413-7070
M: 510-207-4221
jacklyn@mavenproperties.com
O: 510-413-7070
M: 510-207-4221
jacklyn@mavenproperties.com
While we strive to provide the most accurate information, all listing information, and demographic data, is provided by third-parties. As such, MyEListing will not be responsible for the accuracy of the information. It is strongly recommended that you verify all information with the listing agent, and any relevant agencies, prior to making any decisions.


