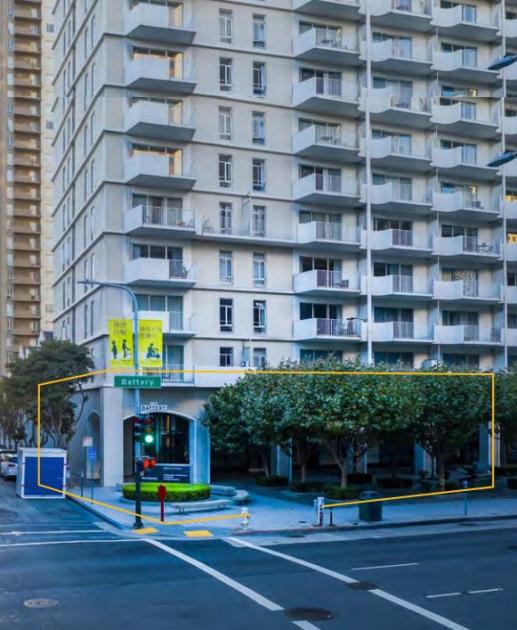
Retail Space
465 Davis Court San Francisco, CA 94111
465 Davis Court San Francisco, CA 94111
Details & Description
Property Highlights
- • - 5,025 SF
- • Vast Ceilings
- • Landlord will negotiate a new facade
- • Easy customer drop-off area located in front
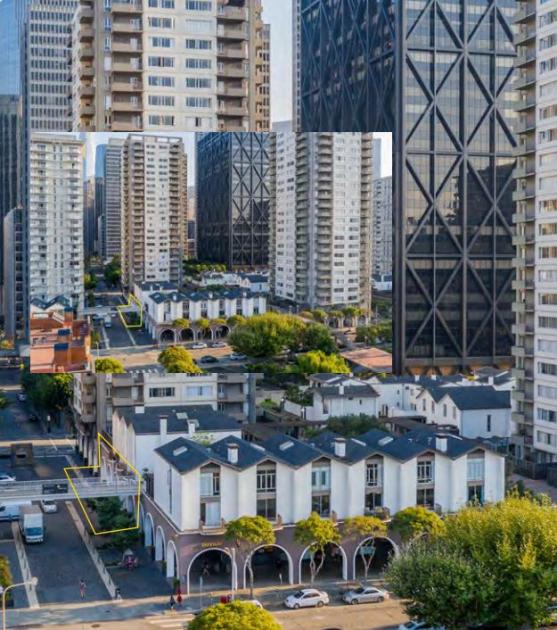
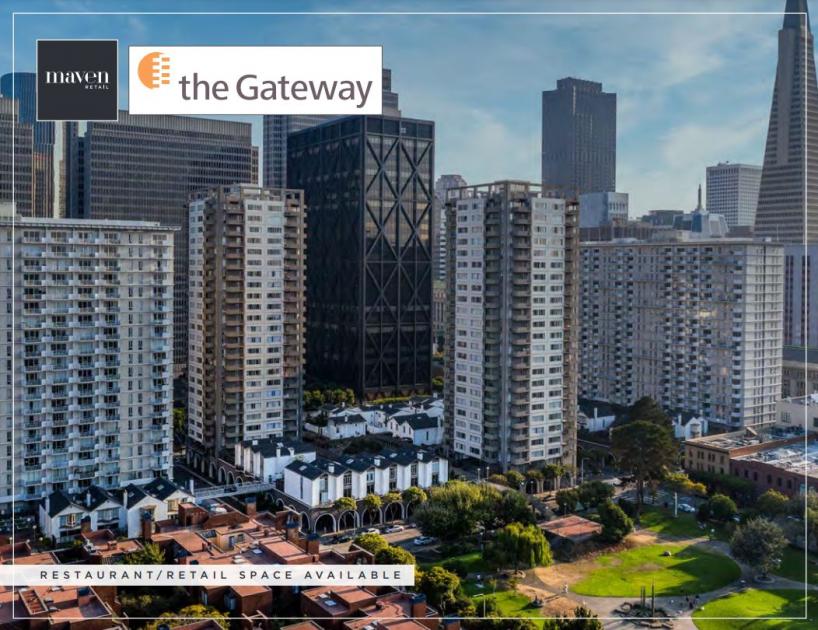
- • Access to adjacent private park
- • Immediately adjacent to Safeway
Listing Agents

Jacklyn Arzio
O: 510-413-7070
M: 510-207-4221
jacklyn@mavenproperties.com
O: 510-413-7070
M: 510-207-4221
jacklyn@mavenproperties.com
While we strive to provide the most accurate information, all listing information, and demographic data, is provided by third-parties. As such, MyEListing will not be responsible for the accuracy of the information. It is strongly recommended that you verify all information with the listing agent, and any relevant agencies, prior to making any decisions.