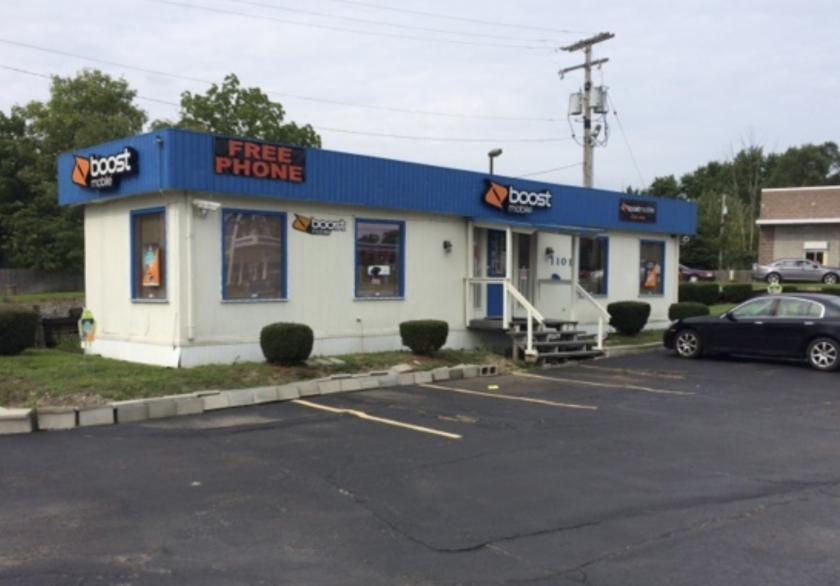
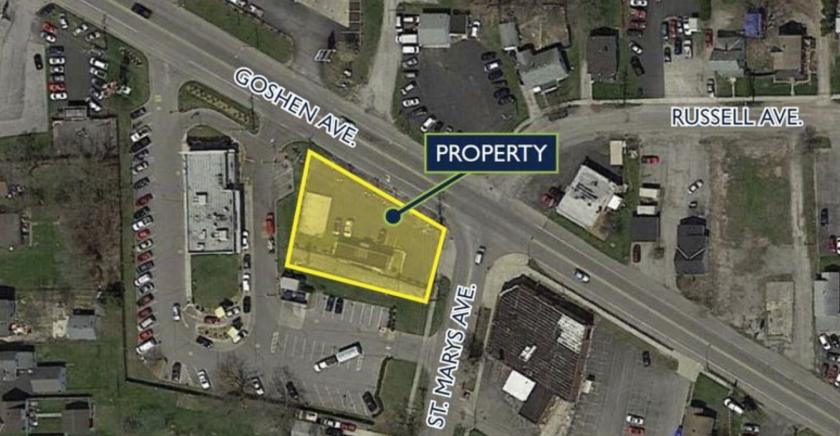
1-Mile | 3-Miles | 5-Miles | ||
---|---|---|---|---|
Total Population | 11,676 | 67,063 | 165,988 | |
Population Median Age | 36 | 36 | 36 | |
Population by Age | 0-9 Yrs | 1725 (14%) | 9354 (13%) | 24358 (14%) |
10-19 Yrs | 1418 (12%) | 8556 (12%) | 21967 (13%) | |
20-29 Yrs | 1735 (14%) | 11635 (17%) | 29358 (17%) | |
30-39 Yrs | 1634 (13%) | 9759 (14%) | 22617 (13%) | |
40-49 Yrs | 1548 (13%) | 8047 (11%) | 18842 (11%) | |
50-59 Yrs | 1541 (13%) | 8061 (12%) | 18756 (11%) | |
60-69 Yrs | 1400 (11%) | 6821 (10%) | 16687 (10%) | |
70+ Yrs | 676 (5%) | 4831 (7%) | 13403 (8%) | |
Median HH Income | $41,815 | $40,300 | $43,695 | |
Total Household Income | < 24K | 1206 (23%) | 8232 (29%) | 18016 (26%) |
25-49K | 1859 (36%) | 8738 (31%) | 20183 (29%) | |
50-74K | 965 (18%) | 5115 (18%) | 13289 (19%) | |
75-99K | 675 (13%) | 2993 (10%) | 7535 (11%) | |
100-199K | 329 (6%) | 2512 (8%) | 7350 (10%) | |
200K+ | 45 (0%) | 378 (1%) | 1042 (1%) | |
Highest Education Level | No Diploma | 1232 | 6548 | 13935 |
Diploma or GED | 3037 | 14263 | 32108 | |
Some College | 1579 | 9282 | 23502 | |
Assoc. Degree | 677 | 4157 | 10748 | |
Bachelors Degree | 867 | 6235 | 17309 | |
Higher Degree | 332 | 3113 | 8026 | |
Total Housing Units | 5,603 | 32,020 | 75,348 | |
--Owner-Occupied | 2,909 | 14,425 | 37,163 | |
--Renter-Occupied | 2,170 | 13,543 | 30,252 | |
Owner-Occupied Values | < 100K | 2439 | 9108 | 19933 |
100-199K | 393 | 4413 | 14378 | |
200-299K | 37 | 555 | 1775 | |
300-399K | 0 | 136 | 561 | |
400-499K | 12 | 54 | 206 | |
500K+ | 28 | 159 | 310 | |
Total Working Age Population | 9,035 | 52,698 | 128,275 | |
In Work Force | 6,215 | 35,008 | 85,480 | |
Not In Work Force | 2,820 | 17,690 | 42,795 | |
Workforce Employed | 5,989 | 33,087 | 80,562 | |
Workforce Unemployed | 226 | 1,894 | 4,870 | |
Civlian Workforce | 6,215 | 34,981 | 85,432 | |
Military Workforce | 0 | 27 | 48 | |
Total Households | 5,079 | 27,968 | 67,415 | |
Family Households | 2,648 | 14,354 | 38,131 | |
Non-Family Households | 2,431 | 13,614 | 29,284 | |
Married Couple | 1,655 | 8,781 | 23,464 | |
Other Family | 993 | 5,573 | 14,667 | |
Married w/Child | 669 | 3,611 | 9,410 | |
Single Male w/Child | 137 | 1,004 | 2,195 | |
Single Female w/Child | 452 | 2,444 | 6,958 |
Population Change Last Two Decades - Plus Projection
2000 | % | 2010 | % | 2020 | % | 2030 | |
---|---|---|---|---|---|---|---|
Indiana | 6,080,485 | +7 | 6,483,802 | +4 | 6,738,573 | +4 | 7,014,880 |
Allen County | 331,849 | +7 | 355,329 | +7 | 379,671 | +6 | 402,948 |
Total Working Age Population:
Total Households:
Total Working Age Population:
Total Households:
Total Working Age Population:
Total Households: