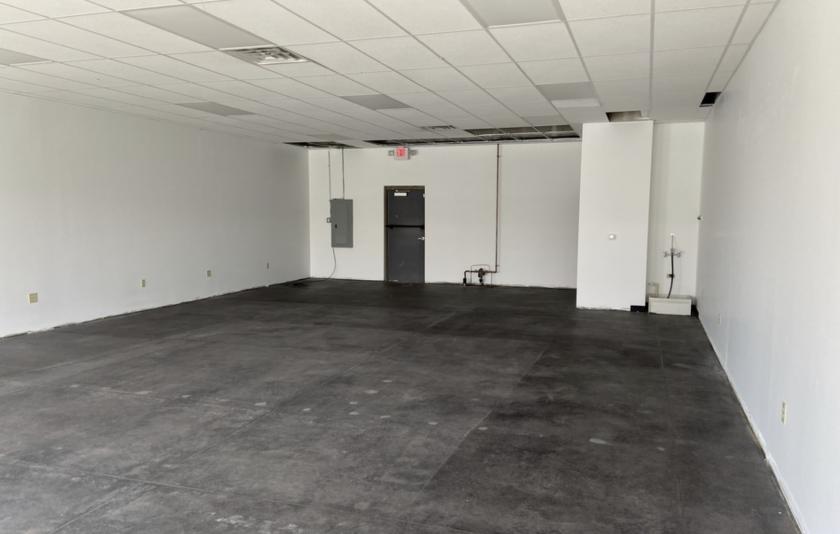
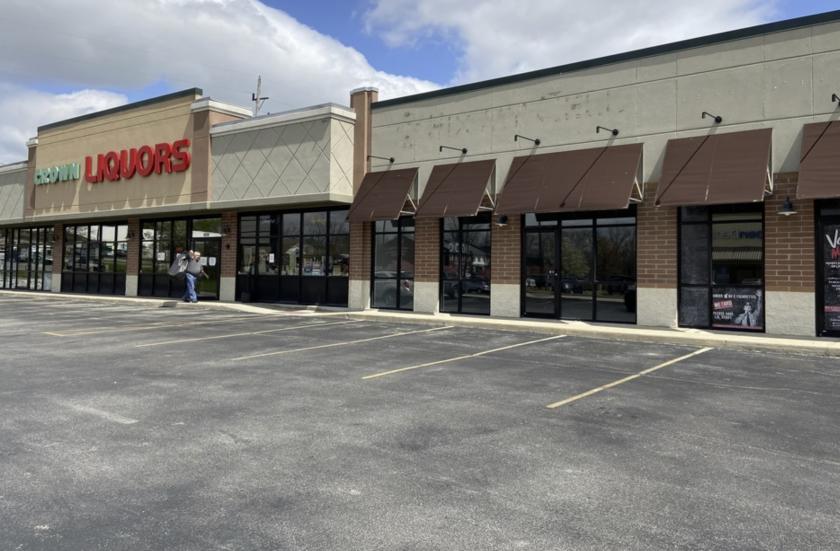
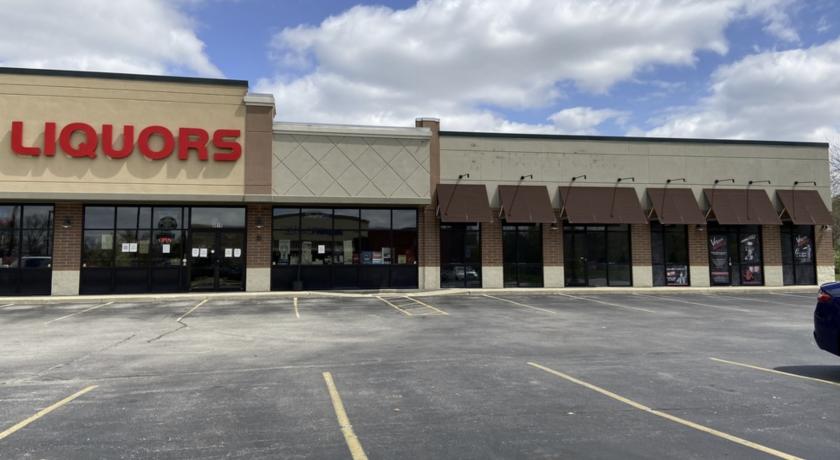
1-Mile | 3-Miles | 5-Miles | ||
---|---|---|---|---|
Total Population | 8,094 | 80,255 | 191,481 | |
Population Median Age | 39 | 37 | 37 | |
Population by Age | 0-9 Yrs | 896 (11%) | 11664 (14%) | 27696 (14%) |
10-19 Yrs | 1199 (14%) | 8722 (10%) | 23876 (12%) | |
20-29 Yrs | 960 (11%) | 12427 (15%) | 27534 (14%) | |
30-39 Yrs | 1156 (14%) | 12590 (15%) | 27095 (14%) | |
40-49 Yrs | 1064 (13%) | 8913 (11%) | 22042 (11%) | |
50-59 Yrs | 1176 (14%) | 10246 (12%) | 24790 (12%) | |
60-69 Yrs | 914 (11%) | 7870 (9%) | 19799 (10%) | |
70+ Yrs | 728 (8%) | 7822 (9%) | 18650 (9%) | |
Median HH Income | $66,400 | $53,616 | $55,764 | |
Total Household Income | < 24K | 296 (9%) | 6210 (19%) | 13741 (18%) |
25-49K | 845 (26%) | 8824 (27%) | 18943 (25%) | |
50-74K | 628 (19%) | 6755 (20%) | 15180 (20%) | |
75-99K | 454 (14%) | 4268 (13%) | 9860 (13%) | |
100-199K | 796 (25%) | 5490 (17%) | 13651 (18%) | |
200K+ | 133 (4%) | 728 (2%) | 2276 (3%) | |
Highest Education Level | No Diploma | 468 | 6671 | 14728 |
Diploma or GED | 1488 | 17977 | 41622 | |
Some College | 1022 | 10910 | 25076 | |
Assoc. Degree | 420 | 3882 | 9768 | |
Bachelors Degree | 1497 | 10375 | 24611 | |
Higher Degree | 648 | 4622 | 11464 | |
Total Housing Units | 3,405 | 34,996 | 80,279 | |
--Owner-Occupied | 2,380 | 17,867 | 45,267 | |
--Renter-Occupied | 772 | 14,409 | 28,384 | |
Owner-Occupied Values | < 100K | 235 | 3267 | 8766 |
100-199K | 1405 | 11512 | 27704 | |
200-299K | 584 | 2016 | 5887 | |
300-399K | 97 | 522 | 1733 | |
400-499K | 27 | 243 | 547 | |
500K+ | 32 | 306 | 630 | |
Total Working Age Population | 6,492 | 63,303 | 149,413 | |
In Work Force | 4,227 | 41,955 | 98,125 | |
Not In Work Force | 2,265 | 21,349 | 51,288 | |
Workforce Employed | 4,072 | 40,653 | 94,359 | |
Workforce Unemployed | 155 | 1,286 | 3,611 | |
Civlian Workforce | 4,227 | 41,939 | 97,971 | |
Military Workforce | 0 | 15 | 154 | |
Total Households | 3,152 | 32,275 | 73,651 | |
Family Households | 2,092 | 18,467 | 44,488 | |
Non-Family Households | 1,060 | 13,809 | 29,163 | |
Married Couple | 1,824 | 13,203 | 32,592 | |
Other Family | 267 | 5,263 | 11,896 | |
Married w/Child | 631 | 5,055 | 12,782 | |
Single Male w/Child | 13 | 643 | 1,916 | |
Single Female w/Child | 116 | 2,113 | 4,753 |
Population Change Last Two Decades - Plus Projection
2000 | % | 2010 | % | 2020 | % | 2030 | |
---|---|---|---|---|---|---|---|
Indiana | 6,080,485 | +7 | 6,483,802 | +4 | 6,738,573 | +4 | 7,014,880 |
Johnson County | 115,209 | +21 | 139,654 | +14 | 158,713 | +11 | 176,917 |
Marion County | 860,454 | +5 | 903,393 | +7 | 963,732 | +4 | 1,001,231 |
Total Working Age Population:
Total Households:
Total Working Age Population:
Total Households:
Total Working Age Population:
Total Households: