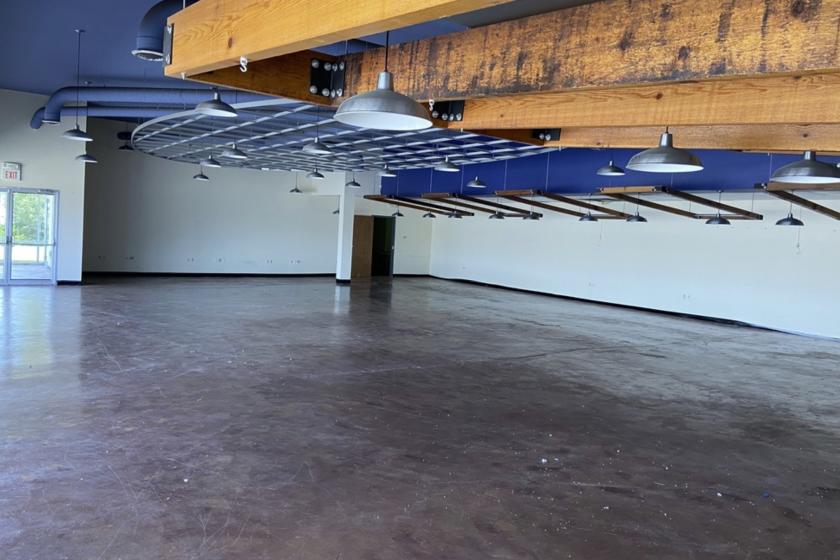
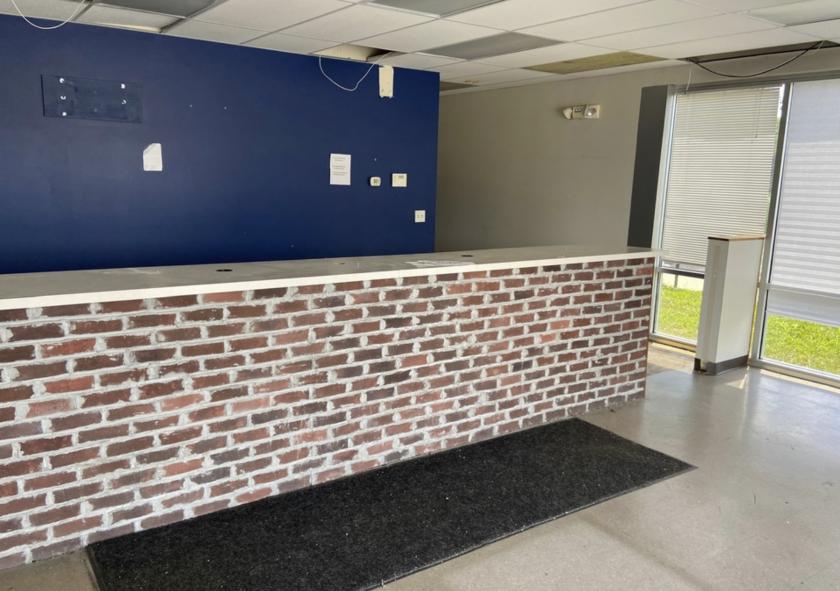
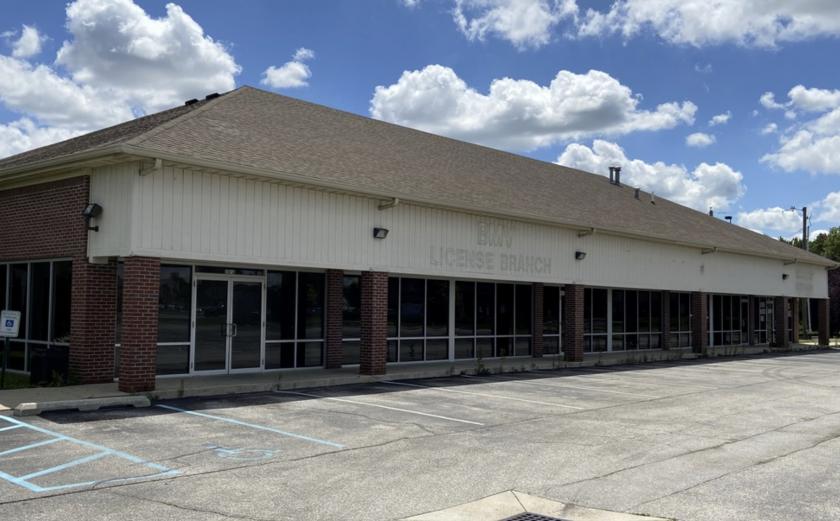
1-Mile | 3-Miles | 5-Miles | ||
---|---|---|---|---|
Total Population | 15,269 | 77,527 | 196,589 | |
Population Median Age | 32 | 34 | 34 | |
Population by Age | 0-9 Yrs | 3123 (20%) | 13630 (17%) | 31466 (16%) |
10-19 Yrs | 2172 (14%) | 10484 (13%) | 29144 (14%) | |
20-29 Yrs | 2582 (16%) | 12711 (16%) | 32599 (16%) | |
30-39 Yrs | 1930 (12%) | 10232 (13%) | 27319 (13%) | |
40-49 Yrs | 1929 (12%) | 8858 (11%) | 22818 (11%) | |
50-59 Yrs | 1775 (11%) | 9455 (12%) | 24097 (12%) | |
60-69 Yrs | 943 (6%) | 6785 (8%) | 16243 (8%) | |
70+ Yrs | 815 (5%) | 5372 (6%) | 12902 (6%) | |
Median HH Income | $37,199 | $40,640 | $41,959 | |
Total Household Income | < 24K | 1676 (31%) | 7706 (27%) | 18498 (26%) |
25-49K | 1745 (33%) | 9268 (32%) | 23048 (32%) | |
50-74K | 907 (17%) | 5421 (19%) | 13589 (19%) | |
75-99K | 634 (12%) | 2935 (10%) | 7848 (11%) | |
100-199K | 262 (4%) | 2404 (8%) | 6505 (9%) | |
200K+ | 50 (0%) | 383 (1%) | 913 (1%) | |
Highest Education Level | No Diploma | 2146 | 9995 | 24112 |
Diploma or GED | 2792 | 15866 | 38919 | |
Some College | 1536 | 9548 | 25269 | |
Assoc. Degree | 842 | 4320 | 9944 | |
Bachelors Degree | 1092 | 5908 | 14934 | |
Higher Degree | 380 | 2499 | 6936 | |
Total Housing Units | 6,010 | 32,188 | 80,946 | |
--Owner-Occupied | 1,893 | 13,660 | 33,410 | |
--Renter-Occupied | 3,382 | 14,456 | 36,991 | |
Owner-Occupied Values | < 100K | 956 | 6449 | 16162 |
100-199K | 803 | 6478 | 15271 | |
200-299K | 62 | 464 | 1362 | |
300-399K | 9 | 79 | 219 | |
400-499K | 0 | 10 | 59 | |
500K+ | 63 | 179 | 338 | |
Total Working Age Population | 10,841 | 57,387 | 147,461 | |
In Work Force | 7,610 | 37,126 | 95,953 | |
Not In Work Force | 3,230 | 20,260 | 51,508 | |
Workforce Employed | 7,147 | 35,119 | 89,617 | |
Workforce Unemployed | 458 | 1,983 | 6,297 | |
Civlian Workforce | 7,605 | 37,102 | 95,914 | |
Military Workforce | 5 | 25 | 39 | |
Total Households | 5,275 | 28,116 | 70,401 | |
Family Households | 3,242 | 16,659 | 41,198 | |
Non-Family Households | 2,034 | 11,458 | 29,203 | |
Married Couple | 1,442 | 9,112 | 22,783 | |
Other Family | 1,800 | 7,547 | 18,415 | |
Married w/Child | 611 | 4,056 | 9,862 | |
Single Male w/Child | 233 | 1,067 | 2,506 | |
Single Female w/Child | 935 | 3,217 | 8,306 |
Population Change Last Two Decades - Plus Projection
2000 | % | 2010 | % | 2020 | % | 2030 | |
---|---|---|---|---|---|---|---|
Indiana | 6,080,485 | +7 | 6,483,802 | +4 | 6,738,573 | +4 | 7,014,880 |
Hendricks County | 104,093 | +40 | 145,448 | +17 | 170,323 | +16 | 197,902 |
Marion County | 860,454 | +5 | 903,393 | +7 | 963,732 | +4 | 1,001,231 |
Total Working Age Population:
Total Households:
Total Working Age Population:
Total Households:
Total Working Age Population:
Total Households: