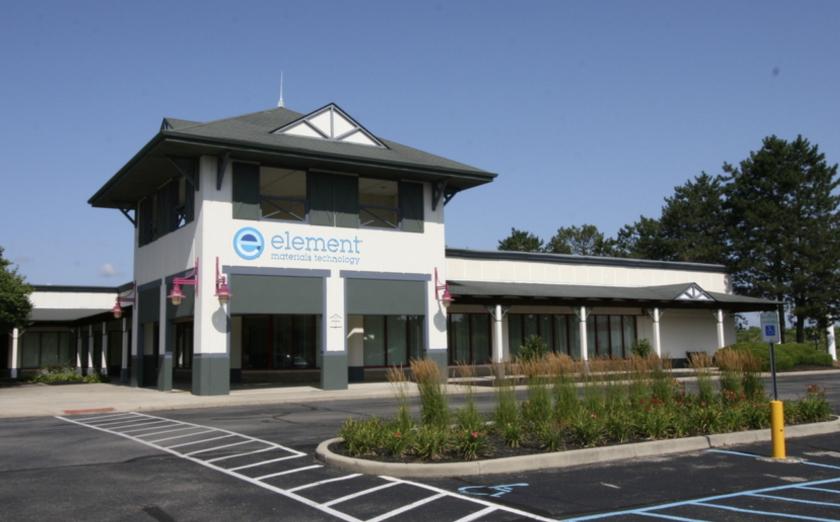
Office Space
9301 Innovation Drive Daleville, IN 47334
9301 Innovation Drive Daleville, IN 47334
Details & Description
Property Highlights
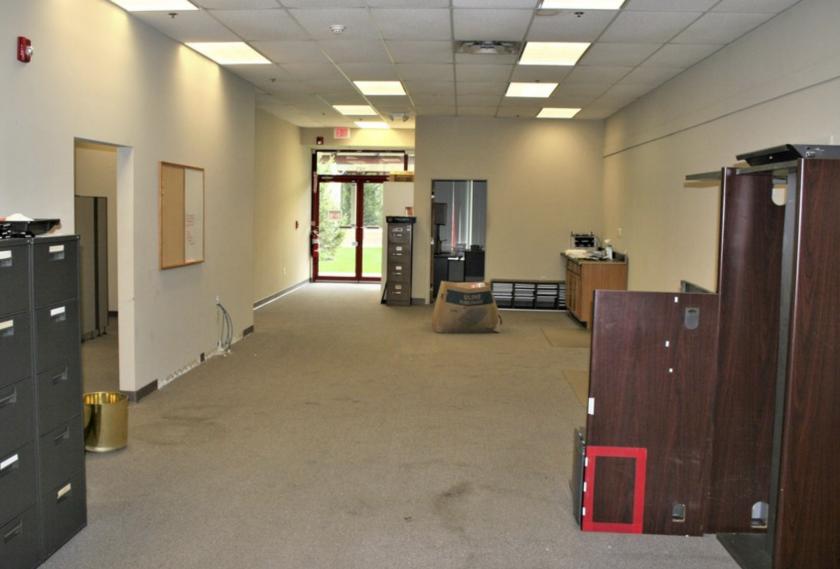
• Well lit open spaces with perimeter offices and conference rooms in the main entry. Larger perimeter spaces available.
• Space is ideal for many users, engineering, architects, data center, temp workforce office and many more.
Listing Agents

Bill Drinkall
O: 260-755-7880
M: 260-715-3408
bdrinkall@bradleyco.com
O: 260-755-7880
M: 260-715-3408
bdrinkall@bradleyco.com
While we strive to provide the most accurate information, all listing information, and demographic data, is provided by third-parties. As such, MyEListing will not be responsible for the accuracy of the information. It is strongly recommended that you verify all information with the listing agent, and any relevant agencies, prior to making any decisions.