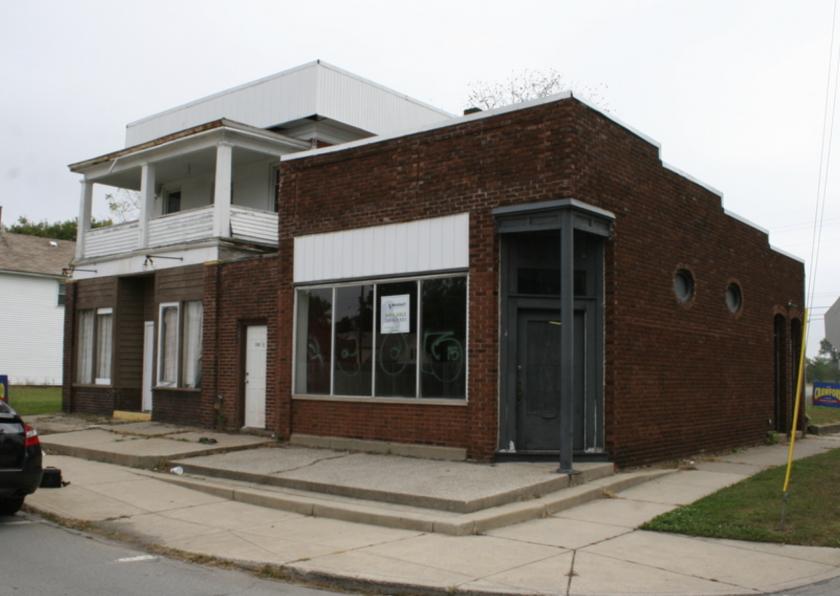
1-Mile | 3-Miles | 5-Miles | ||
---|---|---|---|---|
Total Population | 15,674 | 83,924 | 179,979 | |
Population Median Age | 36 | 35 | 36 | |
Population by Age | 0-9 Yrs | 2114 (13%) | 12791 (15%) | 26509 (14%) |
10-19 Yrs | 1640 (10%) | 12056 (14%) | 24794 (13%) | |
20-29 Yrs | 3119 (19%) | 14333 (17%) | 30671 (17%) | |
30-39 Yrs | 2414 (15%) | 11893 (14%) | 23917 (13%) | |
40-49 Yrs | 2060 (13%) | 9901 (11%) | 20917 (11%) | |
50-59 Yrs | 1810 (11%) | 9396 (11%) | 20496 (11%) | |
60-69 Yrs | 1635 (10%) | 7748 (9%) | 17904 (9%) | |
70+ Yrs | 881 (5%) | 5807 (6%) | 14771 (8%) | |
Median HH Income | $37,449 | $39,007 | $42,653 | |
Total Household Income | < 24K | 2300 (33%) | 10623 (31%) | 19902 (27%) |
25-49K | 2134 (30%) | 10268 (30%) | 22004 (30%) | |
50-74K | 1116 (16%) | 6123 (18%) | 14090 (19%) | |
75-99K | 696 (10%) | 3471 (10%) | 8059 (11%) | |
100-199K | 579 (8%) | 2732 (8%) | 7366 (10%) | |
200K+ | 93 (1%) | 465 (1%) | 964 (1%) | |
Highest Education Level | No Diploma | 1851 | 8312 | 16644 |
Diploma or GED | 3560 | 16950 | 35210 | |
Some College | 2235 | 11422 | 25062 | |
Assoc. Degree | 820 | 4673 | 11508 | |
Bachelors Degree | 1402 | 7234 | 17402 | |
Higher Degree | 619 | 3545 | 7898 | |
Total Housing Units | 8,058 | 38,924 | 81,333 | |
--Owner-Occupied | 2,739 | 17,118 | 40,080 | |
--Renter-Occupied | 4,178 | 16,564 | 32,305 | |
Owner-Occupied Values | < 100K | 2145 | 11765 | 22522 |
100-199K | 445 | 4401 | 15153 | |
200-299K | 78 | 614 | 1481 | |
300-399K | 24 | 124 | 429 | |
400-499K | 26 | 89 | 166 | |
500K+ | 22 | 125 | 329 | |
Total Working Age Population | 12,630 | 63,986 | 138,226 | |
In Work Force | 8,137 | 42,361 | 91,374 | |
Not In Work Force | 4,493 | 21,624 | 46,852 | |
Workforce Employed | 7,811 | 39,676 | 85,529 | |
Workforce Unemployed | 326 | 2,673 | 5,799 | |
Civlian Workforce | 8,137 | 42,349 | 91,329 | |
Military Workforce | 0 | 12 | 45 | |
Total Households | 6,918 | 33,682 | 72,385 | |
Family Households | 3,063 | 18,275 | 41,396 | |
Non-Family Households | 3,854 | 15,407 | 30,989 | |
Married Couple | 1,890 | 10,436 | 25,311 | |
Other Family | 1,174 | 7,839 | 16,085 | |
Married w/Child | 799 | 4,550 | 10,478 | |
Single Male w/Child | 183 | 1,088 | 2,422 | |
Single Female w/Child | 485 | 3,972 | 7,575 |
Population Change Last Two Decades - Plus Projection
2000 | % | 2010 | % | 2020 | % | 2030 | |
---|---|---|---|---|---|---|---|
Indiana | 6,080,485 | +7 | 6,483,802 | +4 | 6,738,573 | +4 | 7,014,880 |
Allen County | 331,849 | +7 | 355,329 | +7 | 379,671 | +6 | 402,948 |
Total Working Age Population:
Total Households:
Total Working Age Population:
Total Households:
Total Working Age Population:
Total Households: