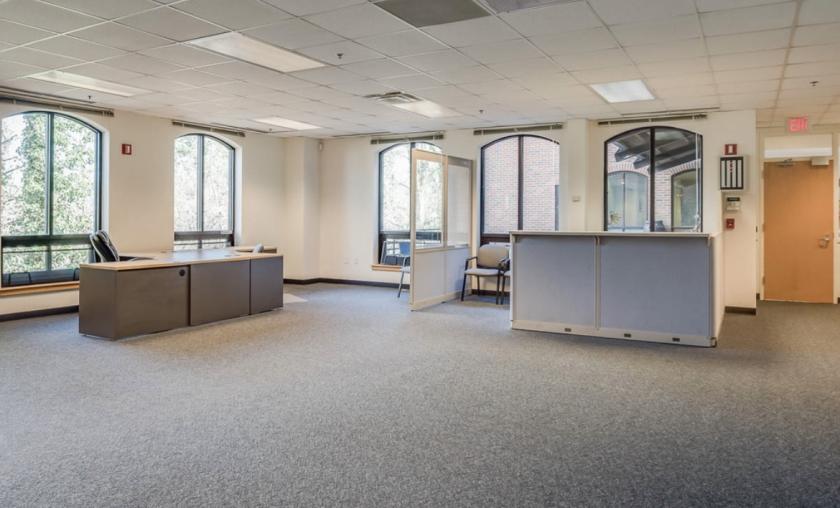
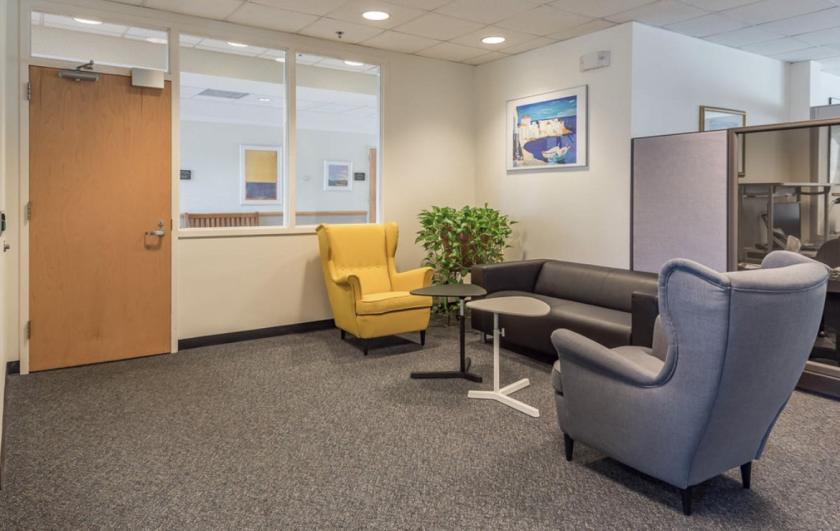
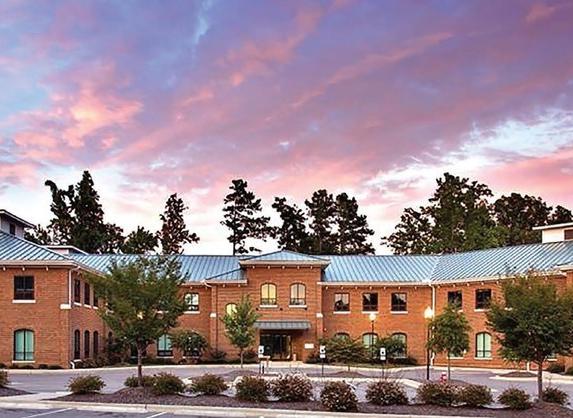
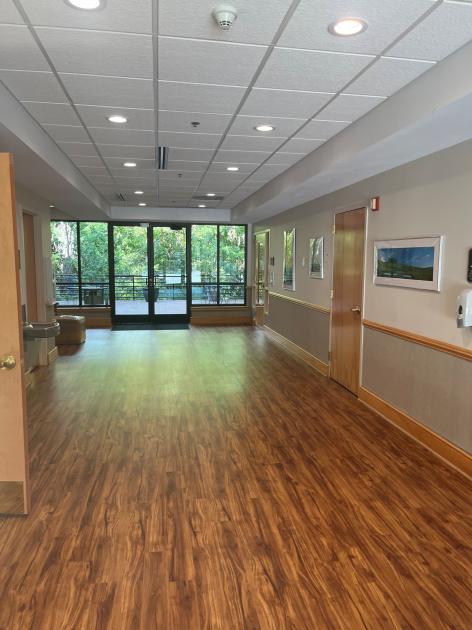
Office Space
610 Jones Ferry Road Carrboro, NC 27510
610 Jones Ferry Road Carrboro, NC 27510
Details & Description
Property Highlights
- • Office/medical condo for sale/lease
- • Space can be subdivided
- • Previous use was robotics manufacturer
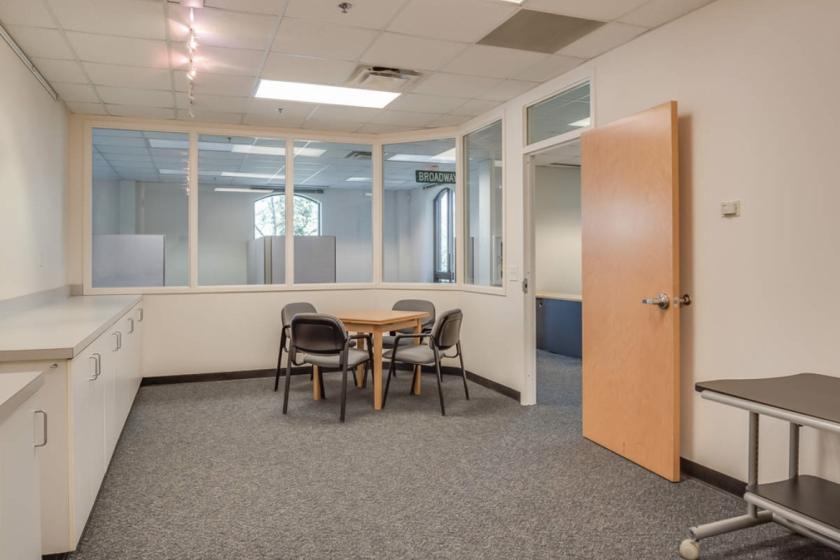
Additional Photos


Listing Agents

Brian Farmer
O: 919-576-2503
M: 919-730-6584
bfarmer@lee-associates.com
O: 919-576-2503
M: 919-730-6584
bfarmer@lee-associates.com

Daniel Cheng
Lee & Associates
O: 919-591-2277
M: 919-218-7146
dcheng@lee-associates.com
Lee & Associates
O: 919-591-2277
M: 919-218-7146
dcheng@lee-associates.com
While we strive to provide the most accurate information, all listing information, and demographic data, is provided by third-parties. As such, MyEListing will not be responsible for the accuracy of the information. It is strongly recommended that you verify all information with the listing agent, and any relevant agencies, prior to making any decisions.