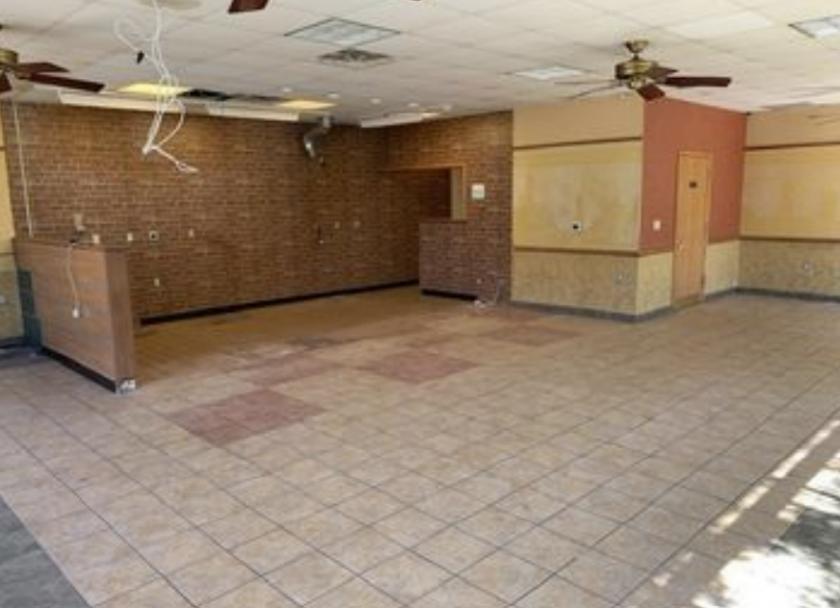
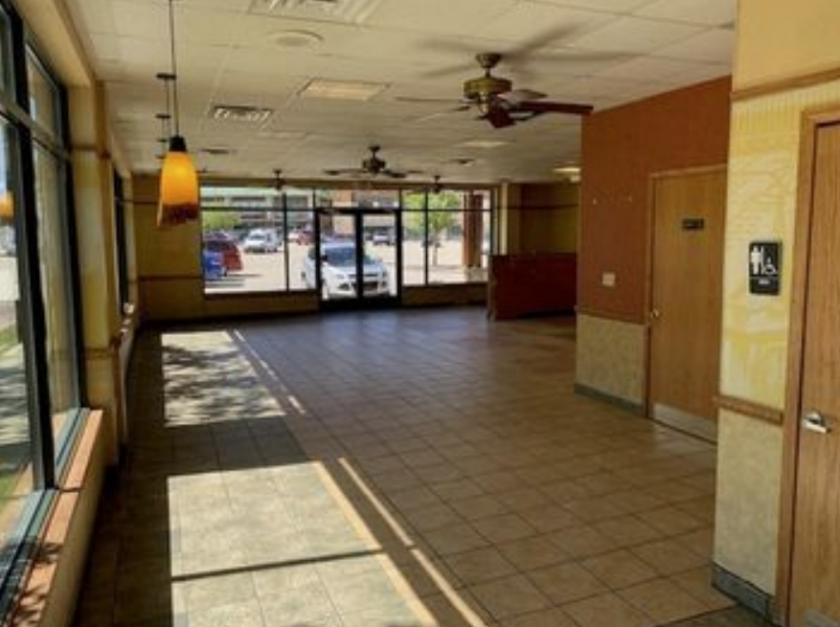
Retail Space
6749 Fulton Street East Ada, MI 49301
6749 Fulton Street East Ada, MI 49301
Details & Description
Property Highlights
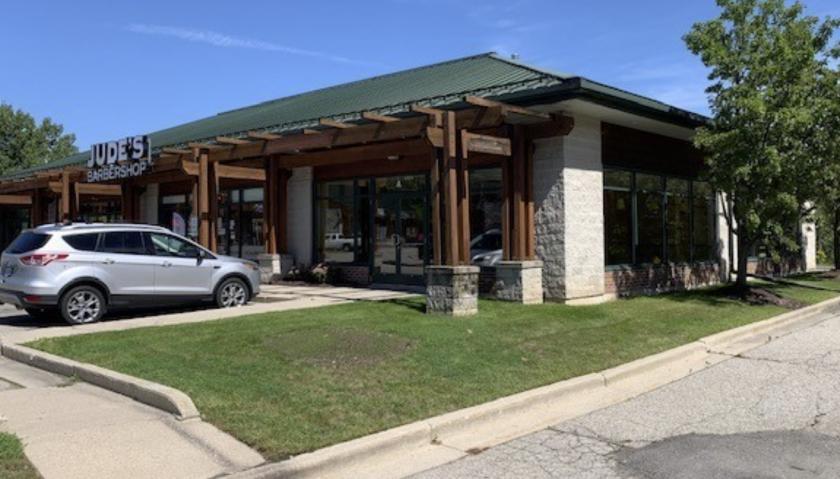
• Other tenants include Mercy Health, Judes Barbershop, Ada Nails, Kamchi Rice Noodles, Ada Dental, Ada Chiropractic
• Strong demographics and fast growing suburb of Grand Rapids, with high per capita income
Listing Agents

Jeff Tucker
O: 616-254-0014
M: 616-881-9321
jtucker@bradleyco.com
O: 616-254-0014
M: 616-881-9321
jtucker@bradleyco.com

Vee Kimbrell
Bradley Company
O: 574-213-5585
vkimbrell@bradleyco.com
Bradley Company
O: 574-213-5585
vkimbrell@bradleyco.com
While we strive to provide the most accurate information, all listing information, and demographic data, is provided by third-parties. As such, MyEListing will not be responsible for the accuracy of the information. It is strongly recommended that you verify all information with the listing agent, and any relevant agencies, prior to making any decisions.