Retail Space
Richard Arrington Jr Blvd and 7th Ave S Birmingham, AL 35233
Richard Arrington Jr Blvd and 7th Ave S Birmingham, AL 35233

Details & Description
Property Highlights
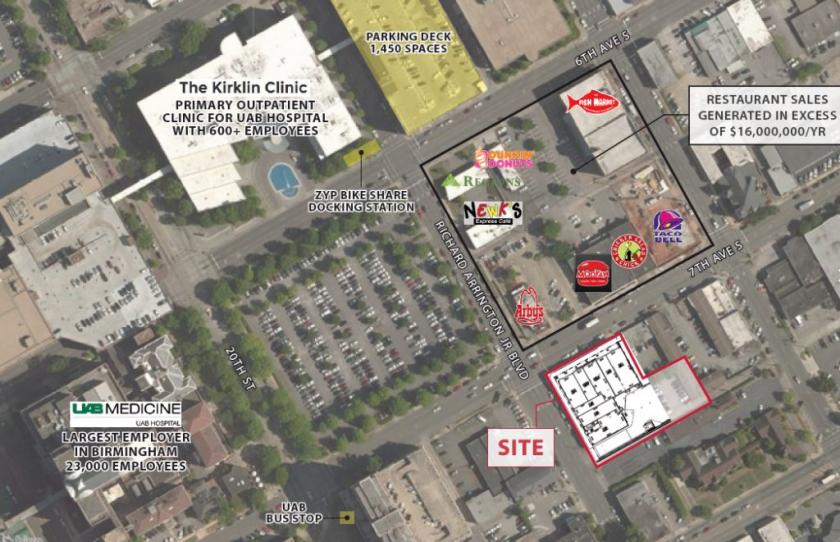
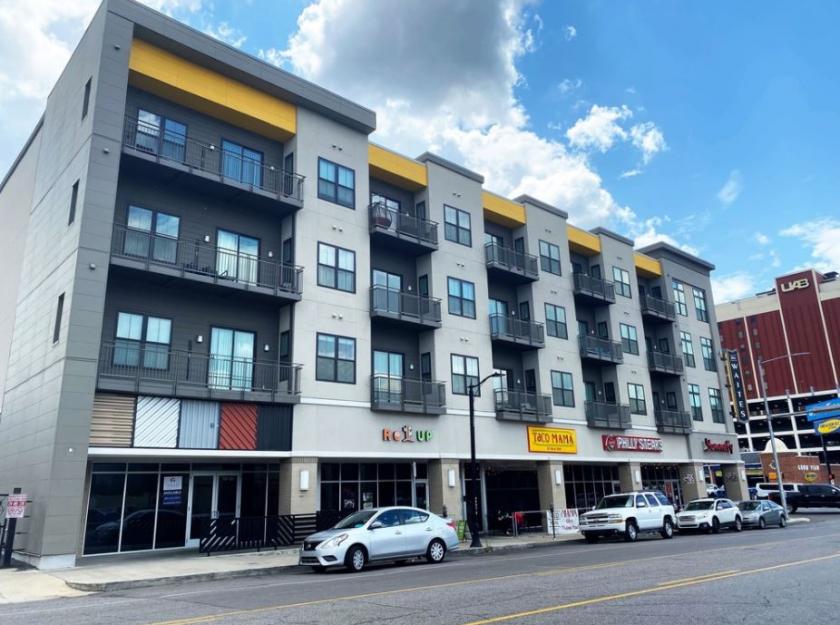
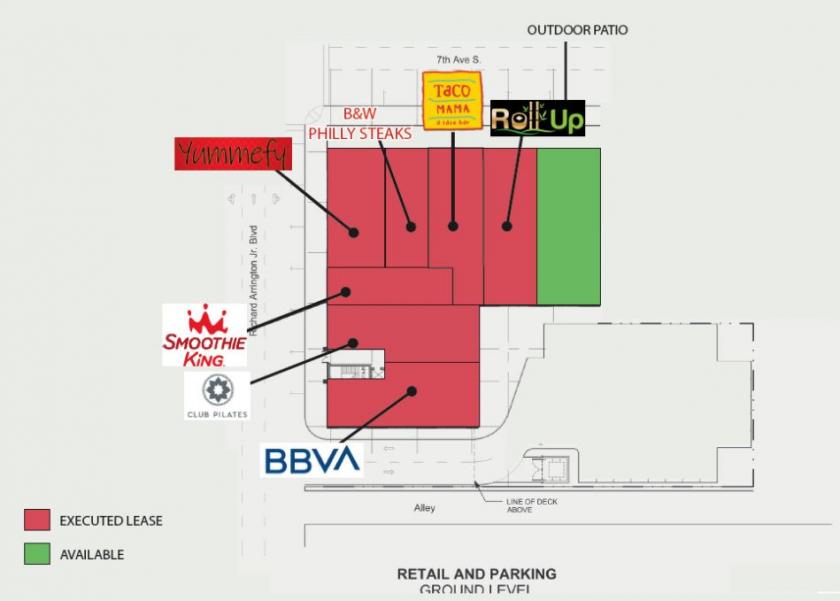
• THE WAITES OFFERS 16,716 SF OF GROUND-FLOOR RETAILRESTAURANT SPACE ALONG WITH 45 LOFT APARTMENTS
• TENANTS TACO MAMA, SMOOTHIE KING, YUMMEFY, BW PHILLY STEAK BBVA
Additional Photos
Listing Agents

Matt Murrell
Retail Specialists
O: 205-490-2828
matt@retailspecialists.com
Retail Specialists
O: 205-490-2828
matt@retailspecialists.com
While we strive to provide the most accurate information, all listing information, and demographic data, is provided by third-parties. As such, MyEListing will not be responsible for the accuracy of the information. It is strongly recommended that you verify all information with the listing agent, and any relevant agencies, prior to making any decisions.


