Retail Space
1480 Eastern Boulevard Montgomery, AL 36117
1480 Eastern Boulevard Montgomery, AL 36117

Details & Description
Property Highlights
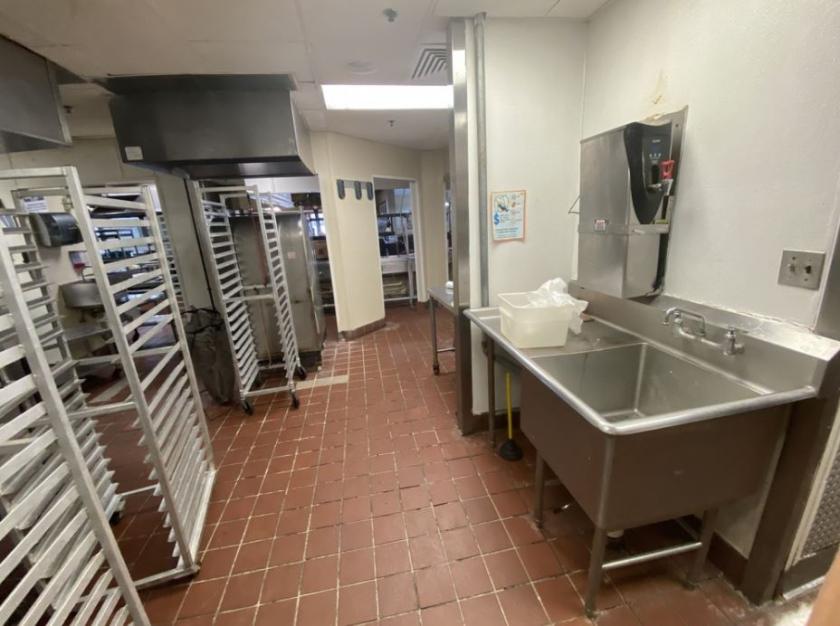
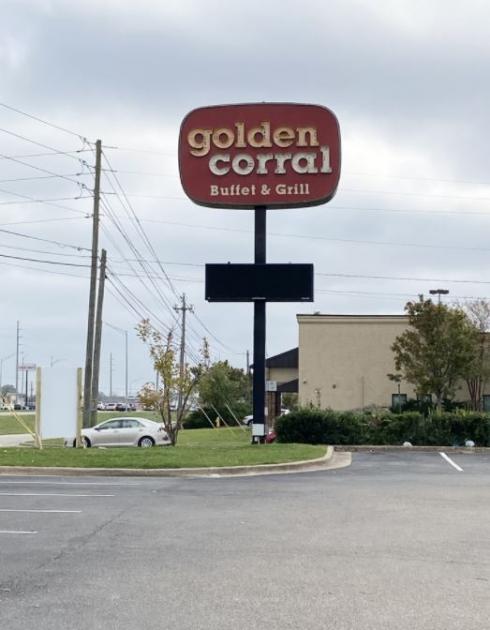
- • 10,355 SF restaurant available for lease
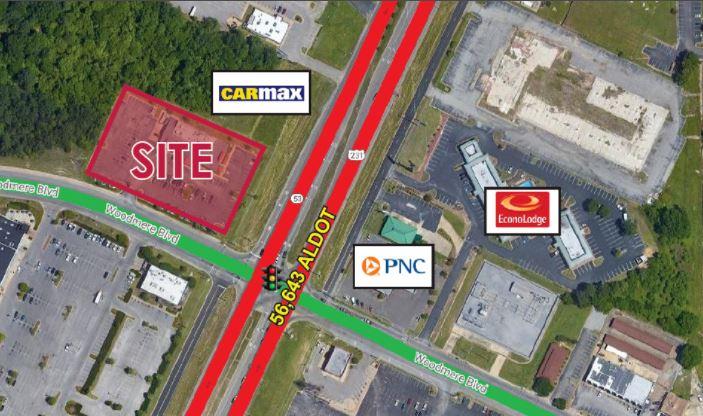
- • Located by I-85 Exit 6
- • Located at a signalized intersection
- • New ALDI opened in Summer 19 down the street
- • Located at a signalized intersection
- • New ALDI opened in Summer 19 down the street
Additional Photos

Listing Agents

Joe Strauss
O: 205-490-2831
jstrauss@retailspecialists.com
O: 205-490-2831
jstrauss@retailspecialists.com
While we strive to provide the most accurate information, all listing information, and demographic data, is provided by third-parties. As such, MyEListing will not be responsible for the accuracy of the information. It is strongly recommended that you verify all information with the listing agent, and any relevant agencies, prior to making any decisions.


