Industrial Properties
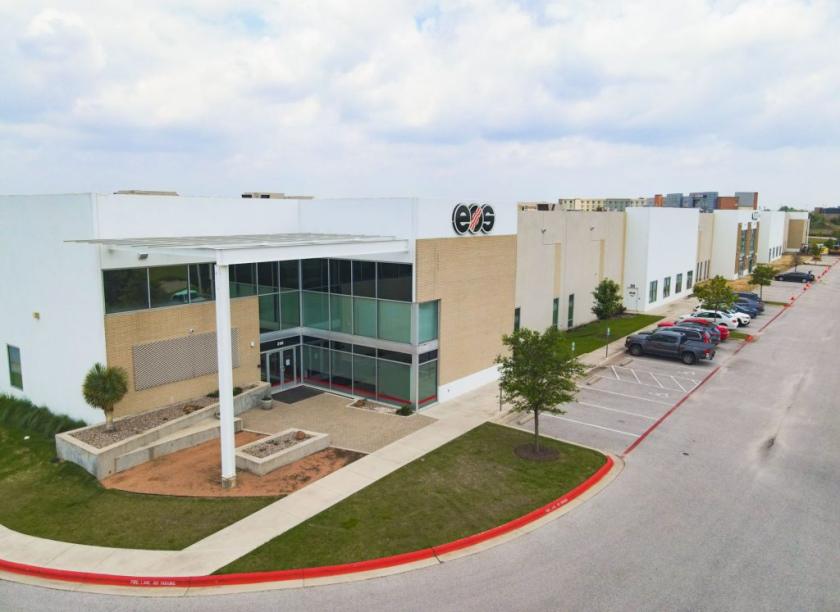
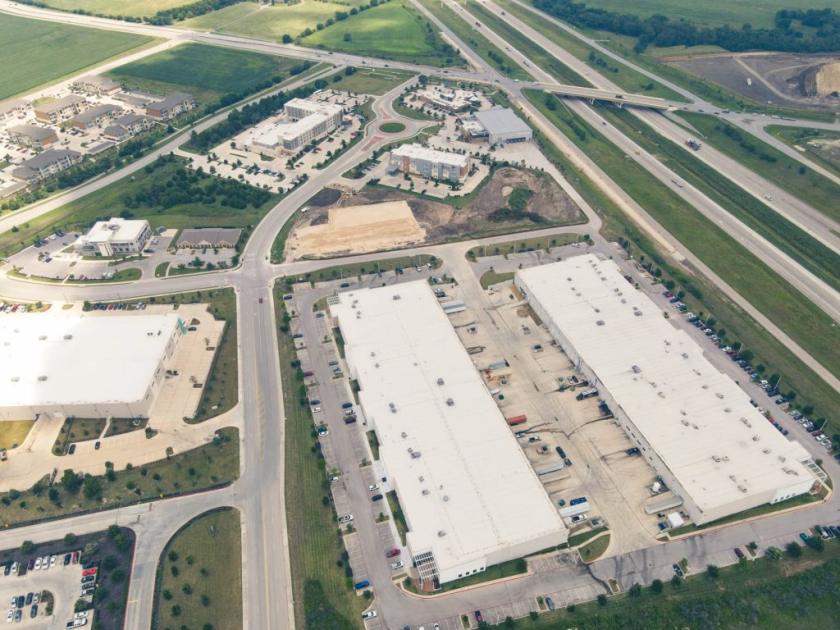
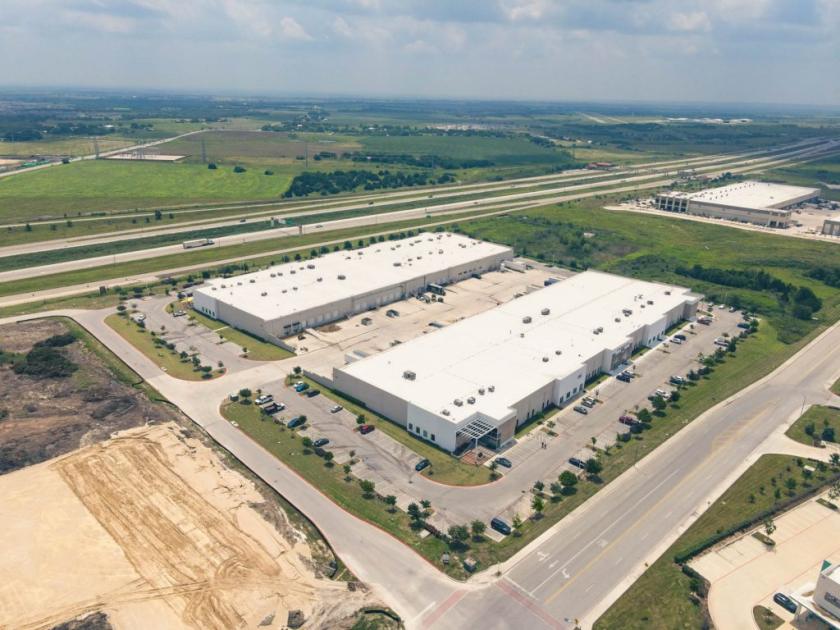
3813 Helios Way Pflugerville, TX 78660
3813 Helios Way Pflugerville, TX 78660
Details & Description
Property Highlights
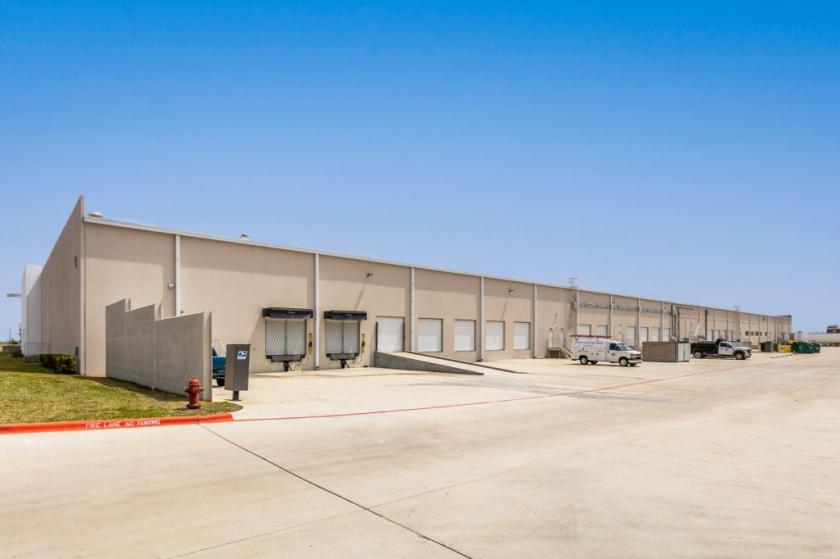
- • Bulk Warehouse
- • 24-27 Clear Height
- • Rear Loading
- • Dock High Doors
- • 180 Truck Court
- • 30x40 Column Spacing
Additional Photos


Listing Agents

Davis Bass
O: 512-538-1030
bass@hpitx.com
O: 512-538-1030
bass@hpitx.com
While we strive to provide the most accurate information, all listing information, and demographic data, is provided by third-parties. As such, MyEListing will not be responsible for the accuracy of the information. It is strongly recommended that you verify all information with the listing agent, and any relevant agencies, prior to making any decisions.