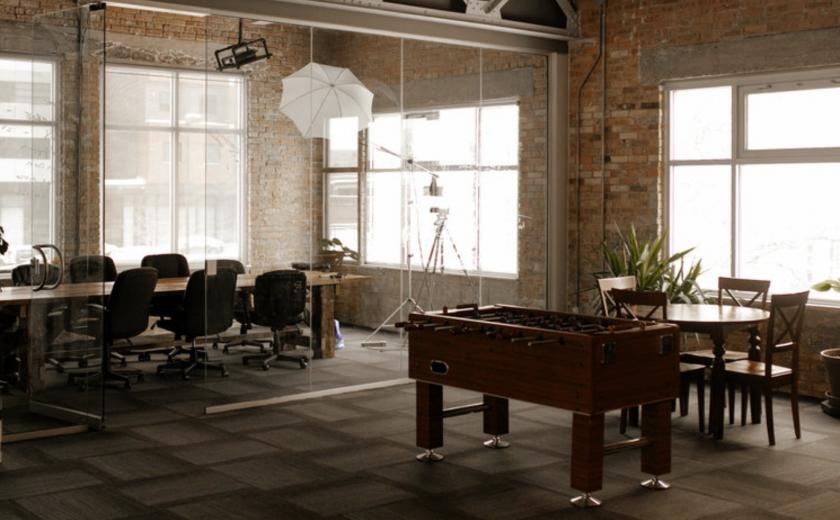
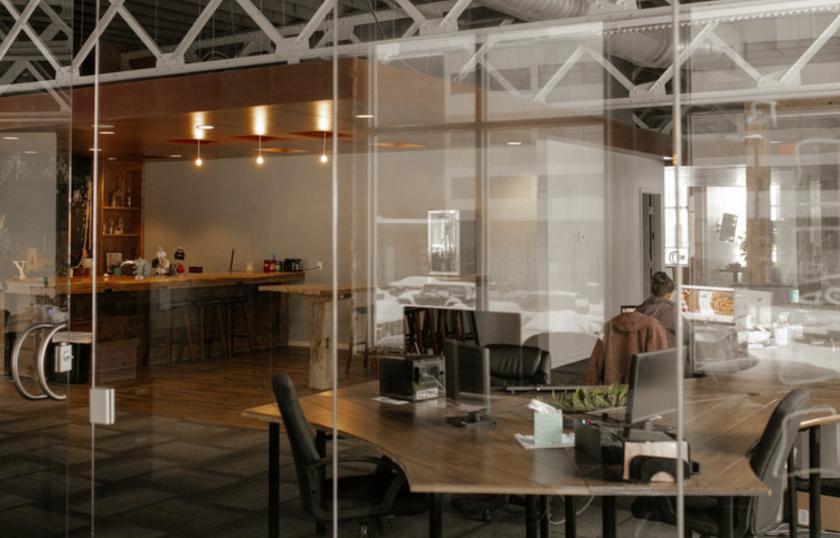
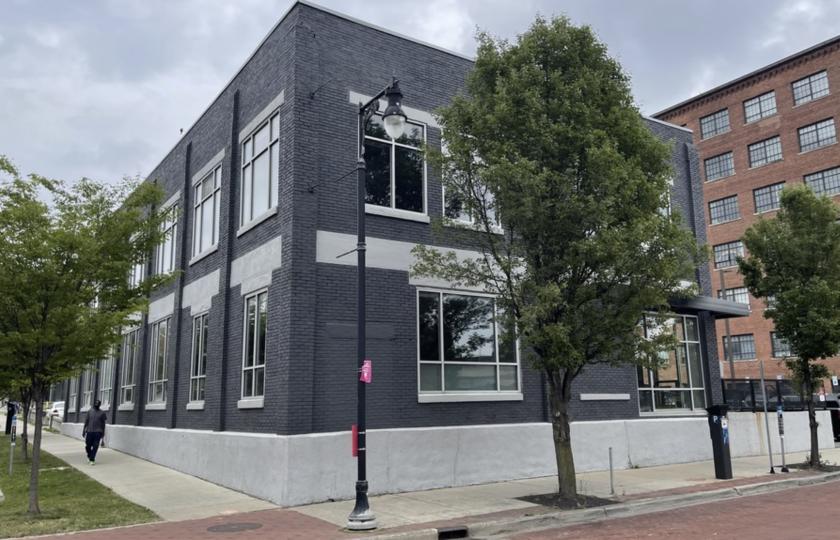
1-Mile | 3-Miles | 5-Miles | ||
---|---|---|---|---|
Total Population | 17,140 | 145,568 | 270,487 | |
Population Median Age | 34 | 33 | 36 | |
Population by Age | 0-9 Yrs | 1514 (8%) | 20310 (13%) | 36255 (13%) |
10-19 Yrs | 1652 (9%) | 19736 (13%) | 34208 (12%) | |
20-29 Yrs | 5636 (32%) | 33233 (22%) | 53213 (19%) | |
30-39 Yrs | 2830 (16%) | 23070 (15%) | 40936 (15%) | |
40-49 Yrs | 1784 (10%) | 15393 (10%) | 28424 (10%) | |
50-59 Yrs | 1724 (10%) | 14970 (10%) | 30819 (11%) | |
60-69 Yrs | 1254 (7%) | 10906 (7%) | 24574 (9%) | |
70+ Yrs | 745 (4%) | 7950 (5%) | 22058 (8%) | |
Median HH Income | $41,153 | $47,852 | $52,980 | |
Total Household Income | < 24K | 2755 (34%) | 13880 (26%) | 22661 (22%) |
25-49K | 1922 (24%) | 13806 (25%) | 26054 (25%) | |
50-74K | 1297 (16%) | 10246 (19%) | 19887 (19%) | |
75-99K | 585 (7%) | 6243 (11%) | 13369 (13%) | |
100-199K | 964 (12%) | 7096 (13%) | 16310 (15%) | |
200K+ | 461 (5%) | 1905 (3%) | 4181 (4%) | |
Highest Education Level | No Diploma | 1482 | 14823 | 22865 |
Diploma or GED | 1767 | 20377 | 41533 | |
Some College | 2009 | 18034 | 36233 | |
Assoc. Degree | 795 | 6600 | 13963 | |
Bachelors Degree | 3472 | 20094 | 40470 | |
Higher Degree | 1775 | 9869 | 20299 | |
Total Housing Units | 9,067 | 58,621 | 109,935 | |
--Owner-Occupied | 2,151 | 27,926 | 61,655 | |
--Renter-Occupied | 5,833 | 25,250 | 40,807 | |
Owner-Occupied Values | < 100K | 479 | 9242 | 14702 |
100-199K | 627 | 13077 | 31663 | |
200-299K | 482 | 3045 | 8557 | |
300-399K | 308 | 1117 | 3061 | |
400-499K | 60 | 458 | 1480 | |
500K+ | 195 | 987 | 2193 | |
Total Working Age Population | 14,687 | 113,408 | 214,123 | |
In Work Force | 10,936 | 80,665 | 148,188 | |
Not In Work Force | 3,752 | 32,742 | 65,935 | |
Workforce Employed | 9,954 | 75,330 | 139,901 | |
Workforce Unemployed | 982 | 5,318 | 8,158 | |
Civlian Workforce | 10,936 | 80,648 | 148,059 | |
Military Workforce | 0 | 17 | 129 | |
Total Households | 7,984 | 53,176 | 102,462 | |
Family Households | 2,768 | 29,434 | 59,526 | |
Non-Family Households | 5,217 | 23,742 | 42,936 | |
Married Couple | 1,727 | 17,782 | 40,572 | |
Other Family | 1,041 | 11,652 | 18,954 | |
Married w/Child | 562 | 7,751 | 16,715 | |
Single Male w/Child | 126 | 1,748 | 2,803 | |
Single Female w/Child | 468 | 5,290 | 7,948 |
Population Change Last Two Decades - Plus Projection
2000 | % | 2010 | % | 2020 | % | 2030 | |
---|---|---|---|---|---|---|---|
Michigan | 9,938,444 | -1 | 9,883,640 | +1 | 10,023,423 | +4 | 10,424,510 |
Kent County | 574,335 | +5 | 602,622 | +11 | 668,535 | +12 | 746,921 |
Total Working Age Population:
Total Households:
Total Working Age Population:
Total Households:
Total Working Age Population:
Total Households: