Commercial Land
5057 Pinnacle Square Birmingham, AL 35235
5057 Pinnacle Square Birmingham, AL 35235

Details & Description
Property Highlights
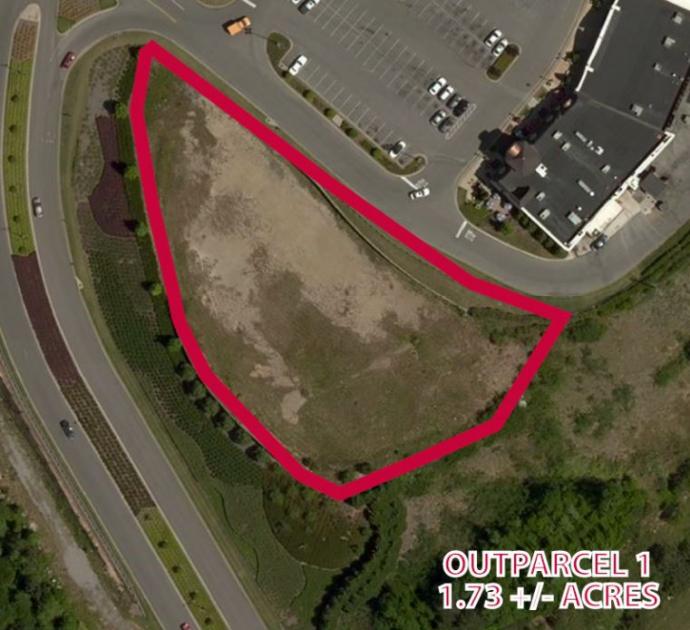
- • Total acreage 8.79 - AC
- • Located at high performing shopping center
- • Outparcels ranging from 1.07 AC - 3.90 AC
Listing Agents

David Plummer
O: 205-314-0395
david@retailspecialists.com
O: 205-314-0395
david@retailspecialists.com
While we strive to provide the most accurate information, all listing information, and demographic data, is provided by third-parties. As such, MyEListing will not be responsible for the accuracy of the information. It is strongly recommended that you verify all information with the listing agent, and any relevant agencies, prior to making any decisions.