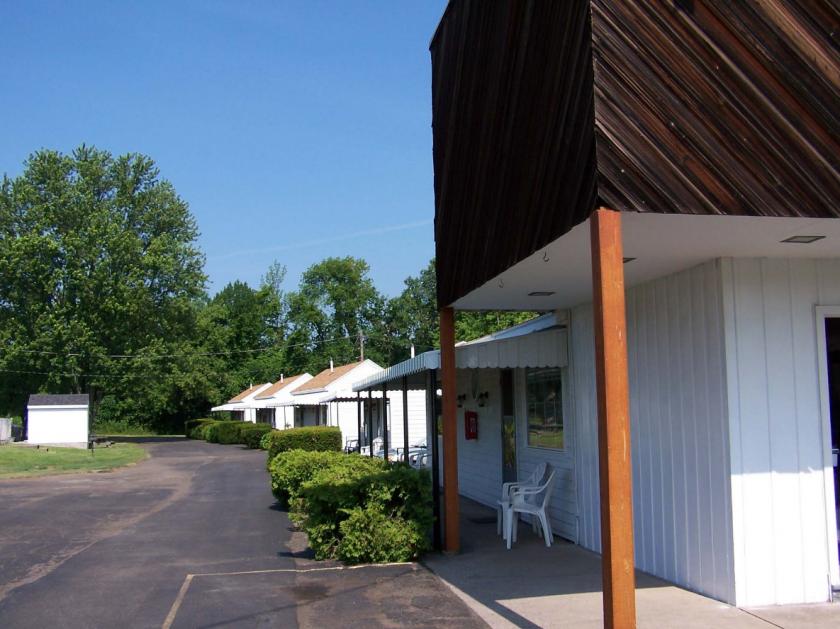
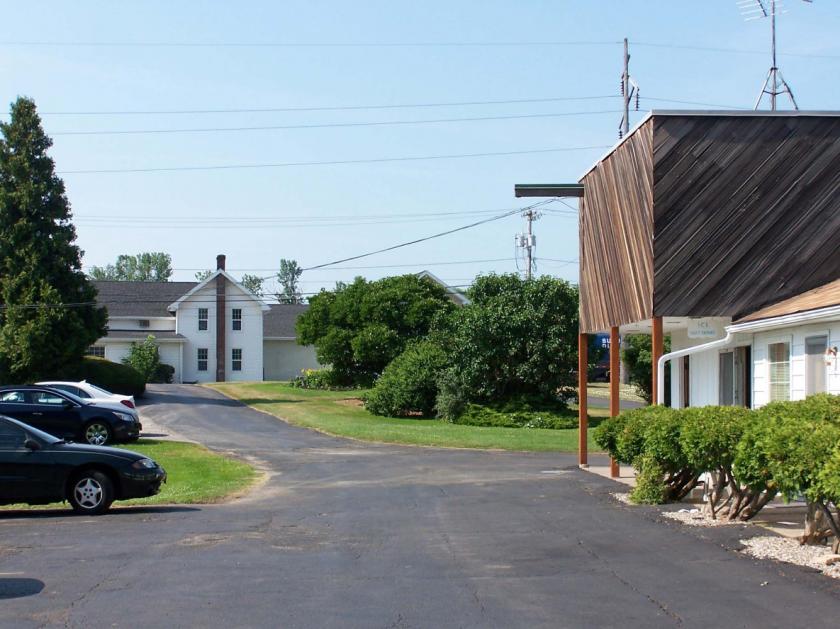
1-Mile | 3-Miles | 5-Miles | ||
---|---|---|---|---|
Total Population | 1,734 | 28,041 | 89,555 | |
Population Median Age | 43 | 43 | 42 | |
Population by Age | 0-9 Yrs | 178 (10%) | 2946 (10%) | 10306 (11%) |
10-19 Yrs | 264 (15%) | 3253 (11%) | 9475 (10%) | |
20-29 Yrs | 119 (6%) | 3218 (11%) | 10345 (11%) | |
30-39 Yrs | 199 (11%) | 3182 (11%) | 10705 (11%) | |
40-49 Yrs | 237 (13%) | 3282 (11%) | 10415 (11%) | |
50-59 Yrs | 235 (13%) | 4190 (14%) | 13458 (15%) | |
60-69 Yrs | 240 (13%) | 3803 (13%) | 12230 (13%) | |
70+ Yrs | 262 (15%) | 4167 (14%) | 12621 (14%) | |
Median HH Income | $75,349 | $72,319 | $66,892 | |
Total Household Income | < 24K | 133 (20%) | 1921 (17%) | 5675 (15%) |
25-49K | 80 (12%) | 2036 (18%) | 8014 (21%) | |
50-74K | 103 (16%) | 1829 (16%) | 6717 (18%) | |
75-99K | 139 (21%) | 1891 (16%) | 5293 (14%) | |
100-199K | 126 (19%) | 2753 (24%) | 9060 (24%) | |
200K+ | 54 (8%) | 739 (6%) | 1695 (4%) | |
Highest Education Level | No Diploma | 88 | 1308 | 5239 |
Diploma or GED | 308 | 5468 | 18745 | |
Some College | 171 | 3371 | 11300 | |
Assoc. Degree | 187 | 2926 | 8714 | |
Bachelors Degree | 297 | 4664 | 13452 | |
Higher Degree | 189 | 2683 | 7795 | |
Total Housing Units | 672 | 11,707 | 38,019 | |
--Owner-Occupied | 497 | 8,197 | 26,156 | |
--Renter-Occupied | 139 | 2,972 | 10,297 | |
Owner-Occupied Values | < 100K | 57 | 735 | 3469 |
100-199K | 237 | 5095 | 17493 | |
200-299K | 143 | 1747 | 4003 | |
300-399K | 42 | 385 | 654 | |
400-499K | 4 | 138 | 257 | |
500K+ | 14 | 96 | 281 | |
Total Working Age Population | 1,420 | 23,270 | 73,595 | |
In Work Force | 828 | 14,903 | 48,156 | |
Not In Work Force | 592 | 8,367 | 25,440 | |
Workforce Employed | 766 | 14,192 | 46,199 | |
Workforce Unemployed | 62 | 711 | 1,949 | |
Civlian Workforce | 828 | 14,903 | 48,147 | |
Military Workforce | 0 | 0 | 9 | |
Total Households | 636 | 11,169 | 36,453 | |
Family Households | 476 | 7,525 | 23,913 | |
Non-Family Households | 159 | 3,644 | 12,541 | |
Married Couple | 371 | 5,835 | 18,206 | |
Other Family | 106 | 1,690 | 5,707 | |
Married w/Child | 113 | 1,780 | 6,098 | |
Single Male w/Child | 4 | 129 | 596 | |
Single Female w/Child | 66 | 723 | 2,247 |
Population Change Last Two Decades - Plus Projection
2000 | % | 2010 | % | 2020 | % | 2030 | |
---|---|---|---|---|---|---|---|
New York | 18,976,457 | +2 | 19,378,102 | +4 | 20,146,131 | +2 | 20,604,030 |
Monroe County | 735,343 | +1 | 744,344 | +1 | 754,529 | +1 | 758,536 |
Total Working Age Population:
Total Households:
Total Working Age Population:
Total Households:
Total Working Age Population:
Total Households: