Office Space
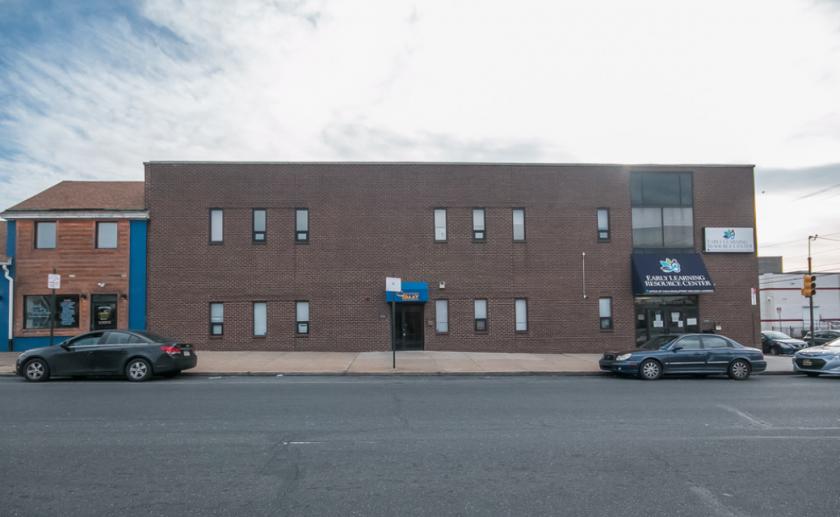
5548 Chestnut Street Philadelphia, PA 19139
5548 Chestnut Street Philadelphia, PA 19139
Details & Description
Property Highlights
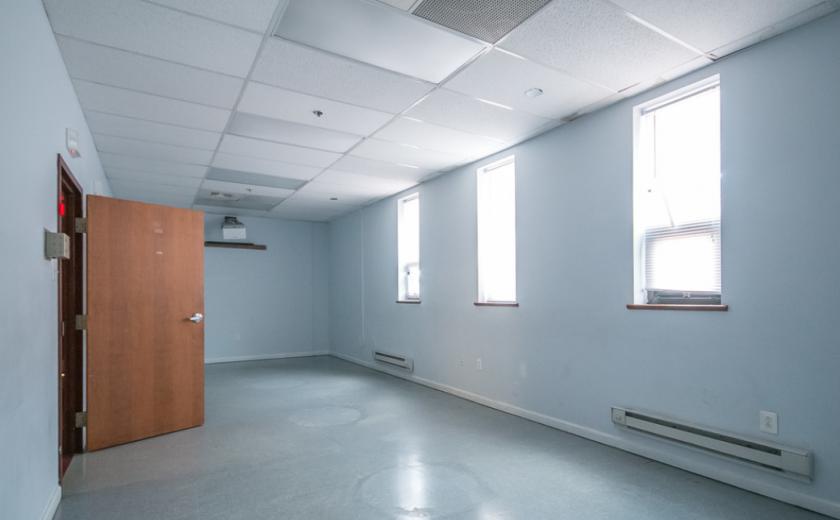
• Features an open reception room, six private offices, and a kitchenette
• Walking distance to West Phillys 52nd Street Commercial Corridor
Additional Photos


Listing Agents

Veronica Blum
O: 267-238-1728
vblum@mpnrealty.com
O: 267-238-1728
vblum@mpnrealty.com
While we strive to provide the most accurate information, all listing information, and demographic data, is provided by third-parties. As such, MyEListing will not be responsible for the accuracy of the information. It is strongly recommended that you verify all information with the listing agent, and any relevant agencies, prior to making any decisions.


