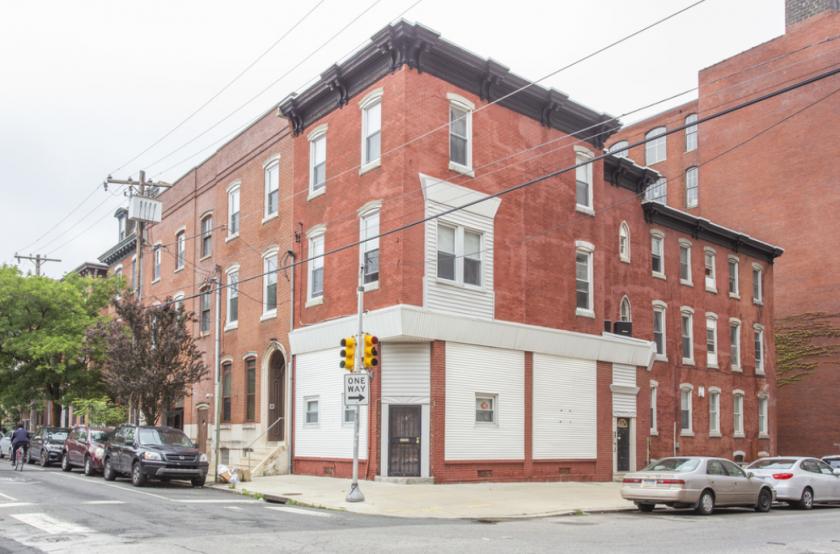
Multifamily Housing
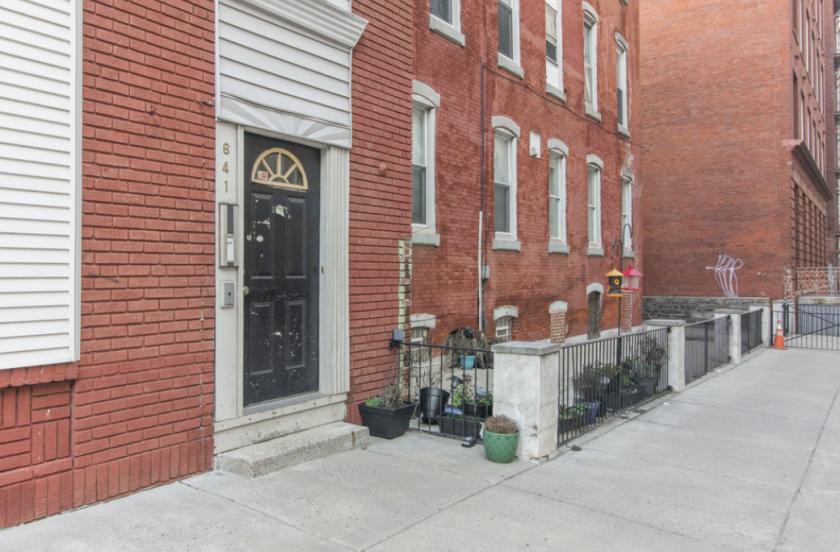
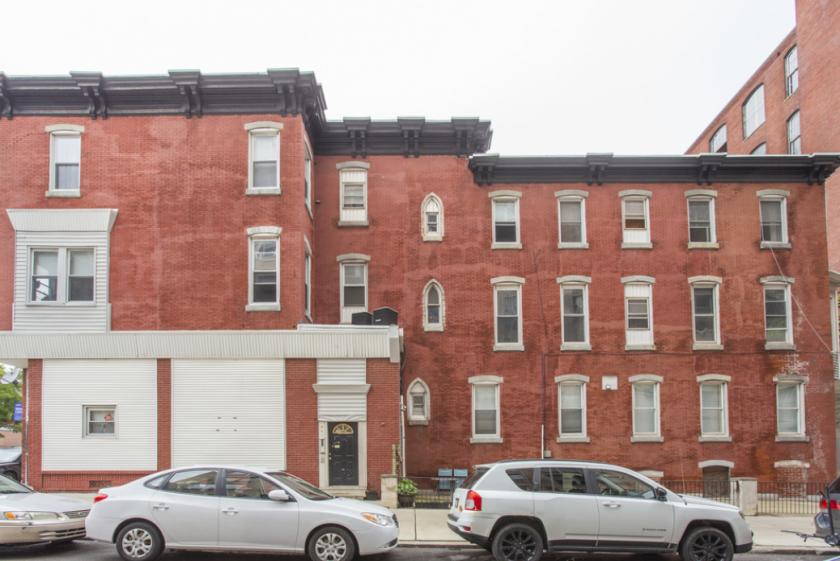
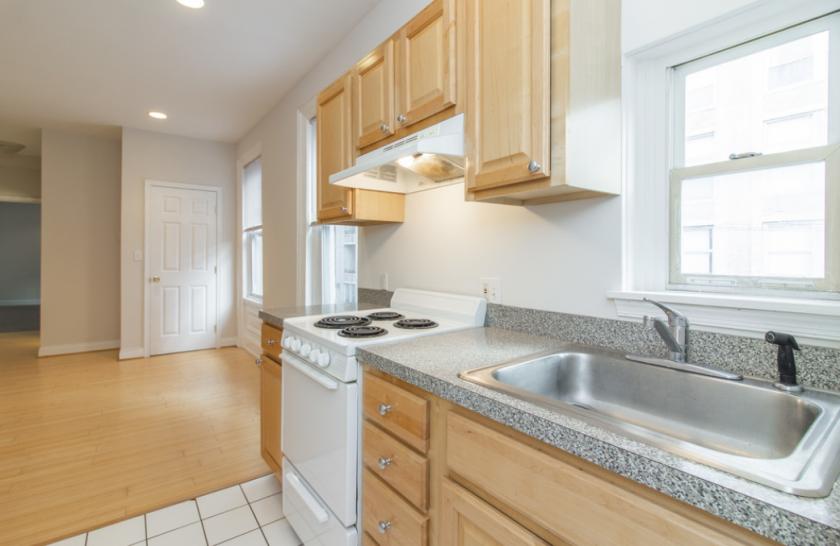
641 North 15th Street Philadelphia, PA 19130
641 North 15th Street Philadelphia, PA 19130
Details & Description
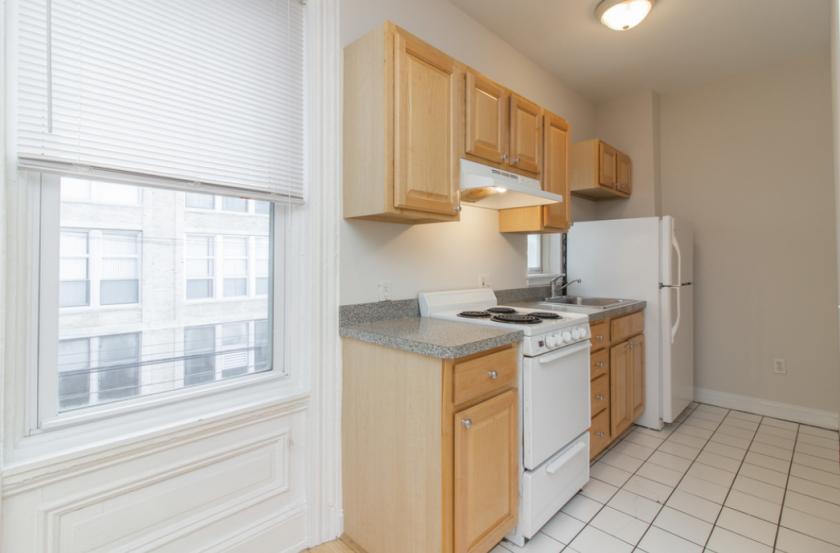
Additional Photos
Listing Agents

Veronica Blum
O: 267-238-1728
vblum@mpnrealty.com
O: 267-238-1728
vblum@mpnrealty.com
While we strive to provide the most accurate information, all listing information, and demographic data, is provided by third-parties. As such, MyEListing will not be responsible for the accuracy of the information. It is strongly recommended that you verify all information with the listing agent, and any relevant agencies, prior to making any decisions.


