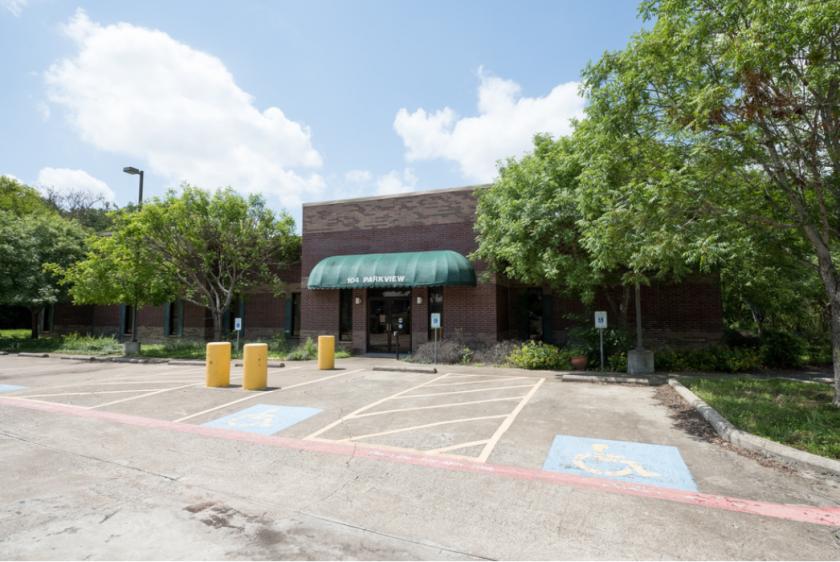
Office Space
104 Parkview Drive Georgetown, TX 78626
104 Parkview Drive Georgetown, TX 78626
Details & Description
Property Highlights
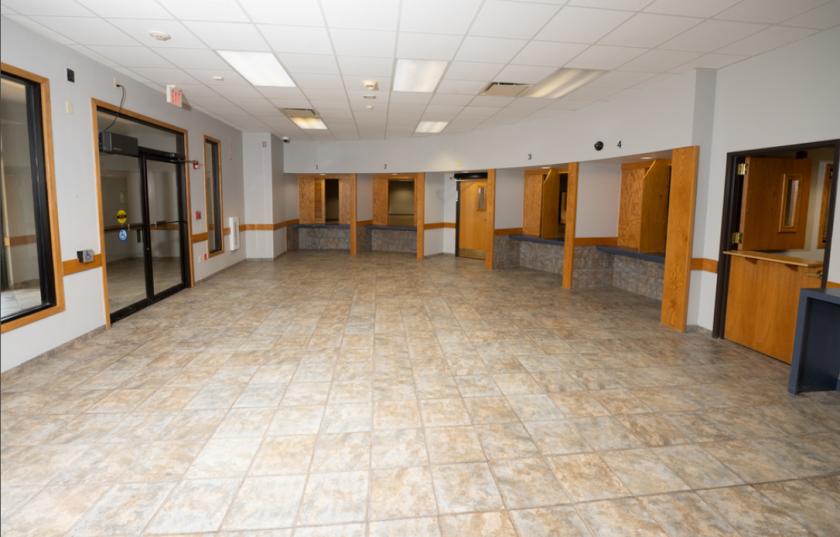
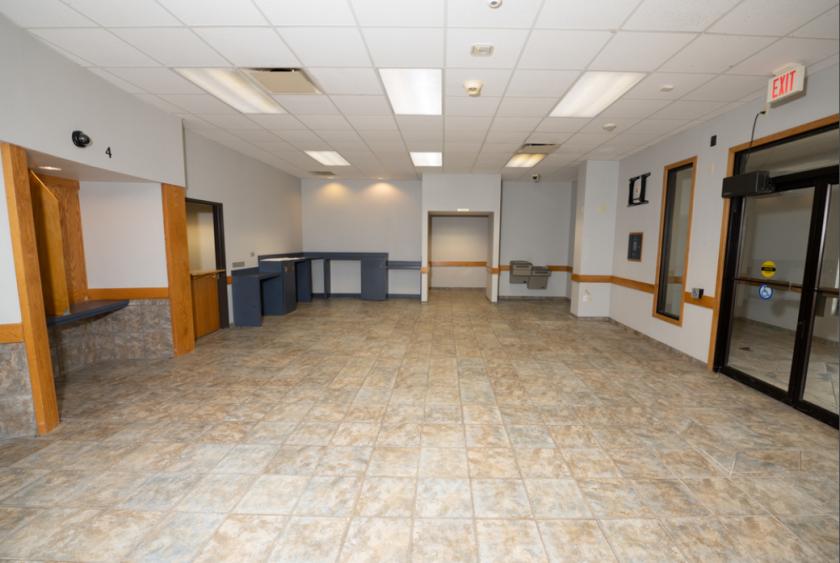
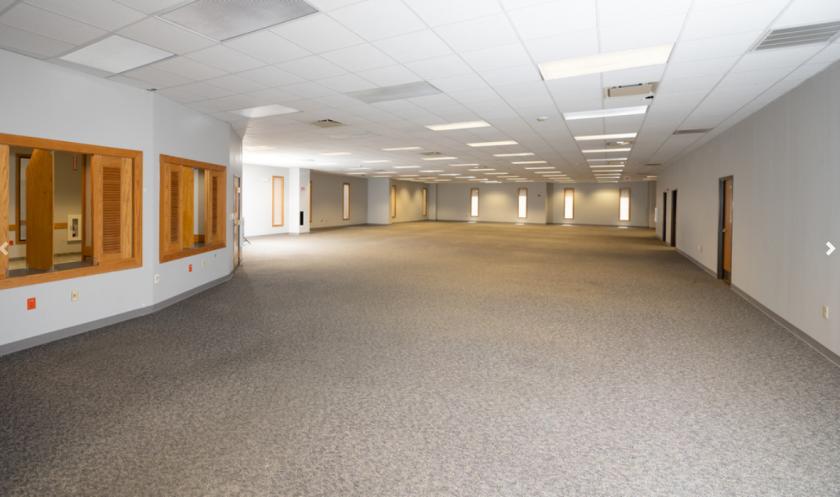
- • Open Floor Plan
- • Expansive 2.22 Acre Parcel
- • 4.5 1000 SF Parking Ratio
- • Desirable North Austin MSA Location
- • Convenient I-35 and Tx-130 Access
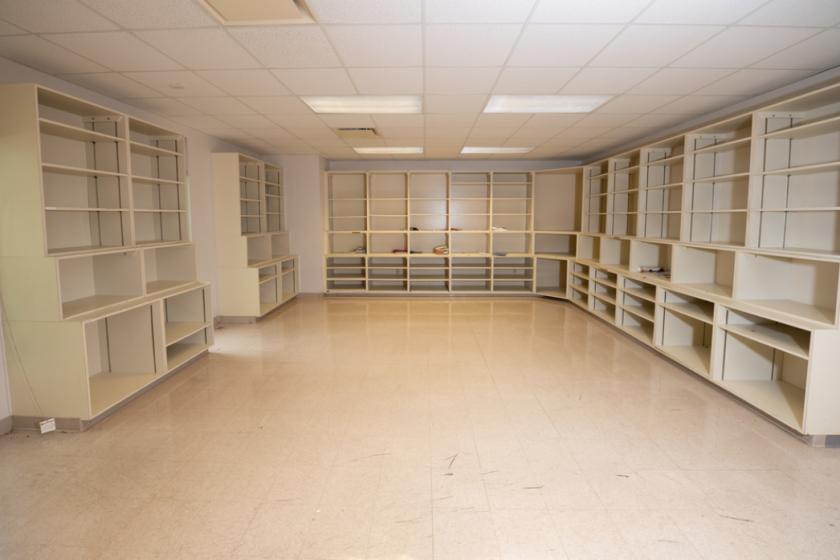
Additional Photos
Listing Agents

Josh Murphy
O: 512-557-5060
josh.murphy@naipartners.com
O: 512-557-5060
josh.murphy@naipartners.com
While we strive to provide the most accurate information, all listing information, and demographic data, is provided by third-parties. As such, MyEListing will not be responsible for the accuracy of the information. It is strongly recommended that you verify all information with the listing agent, and any relevant agencies, prior to making any decisions.


