Retail Space
4107 Blanco Road San Antonio, TX 78212
4107 Blanco Road San Antonio, TX 78212
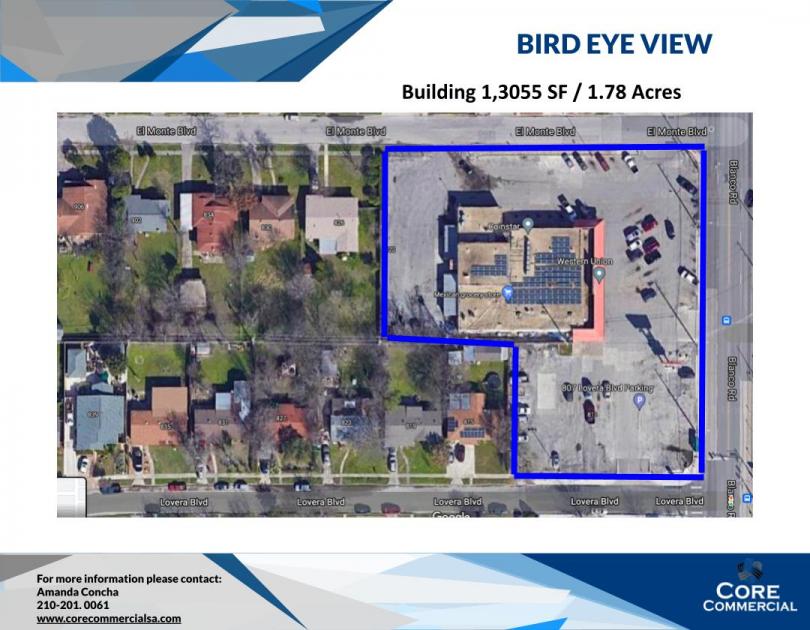
Details & Description
Property Highlights
- • Excellent visibility with high daily foot traffic
- • Located minutes away from Edison High School
- • Built in 1960
- • Ample parking
- • Sale Price Contact Broker
- • Traffic counts 1,299
Listing Agents

Amanda Concha
O: 210-201-0061
M: 210-288-9016
amanda.concha@corecommercialsa.com
O: 210-201-0061
M: 210-288-9016
amanda.concha@corecommercialsa.com
While we strive to provide the most accurate information, all listing information, and demographic data, is provided by third-parties. As such, MyEListing will not be responsible for the accuracy of the information. It is strongly recommended that you verify all information with the listing agent, and any relevant agencies, prior to making any decisions.