Retail Space
1901 East Victory Drive Savannah, GA 31404
1901 East Victory Drive Savannah, GA 31404
Details & Description
Property Highlights
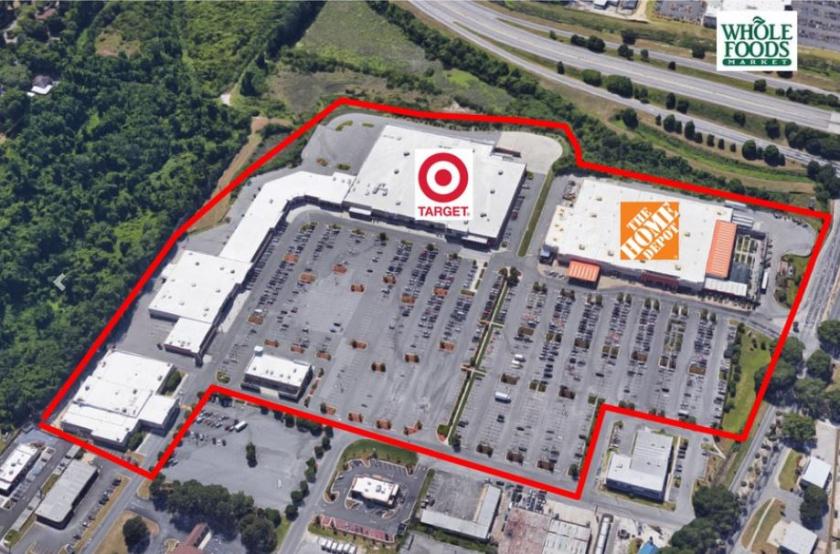
- • 15th busiest Target in the State of Georgia
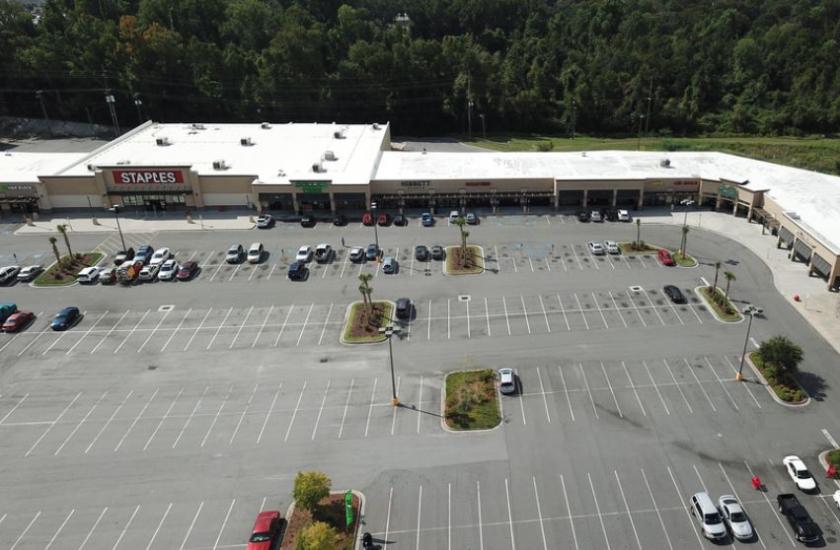
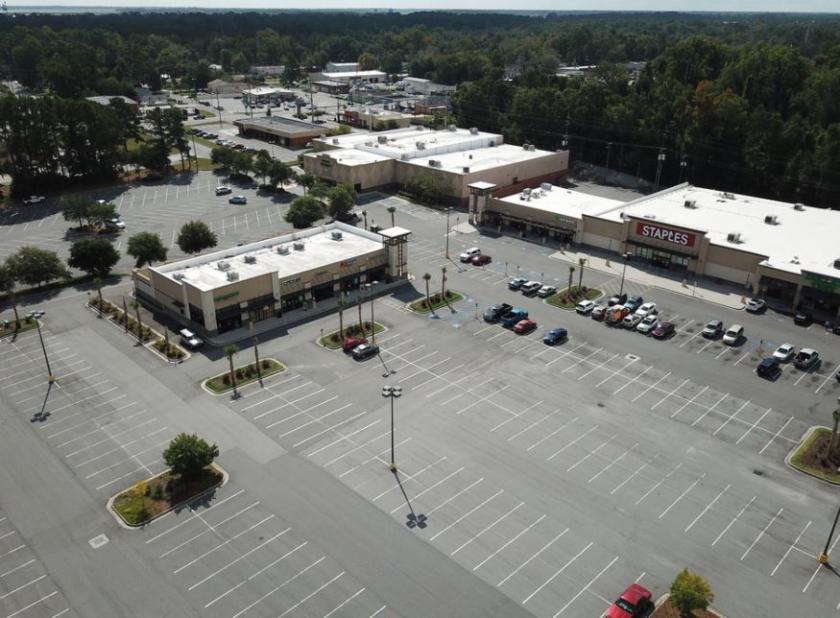
- • Modern, updated exterior
- • Over 3.17 million customer visits last 12 months
- • Excellent visibility and parking
- • Prime location
Additional Photos

Listing Agents

Ryan Schneider
O: 912-353-7707
ryan@piercommercial.com
O: 912-353-7707
ryan@piercommercial.com

Sharon Schneider
Pier CRE
O: 912-353-7707
sharon@piercommercial.com
Pier CRE
O: 912-353-7707
sharon@piercommercial.com
While we strive to provide the most accurate information, all listing information, and demographic data, is provided by third-parties. As such, MyEListing will not be responsible for the accuracy of the information. It is strongly recommended that you verify all information with the listing agent, and any relevant agencies, prior to making any decisions.


