Retail Space
9701 Ford Avenue Richmond Hill, GA 31324
9701 Ford Avenue Richmond Hill, GA 31324
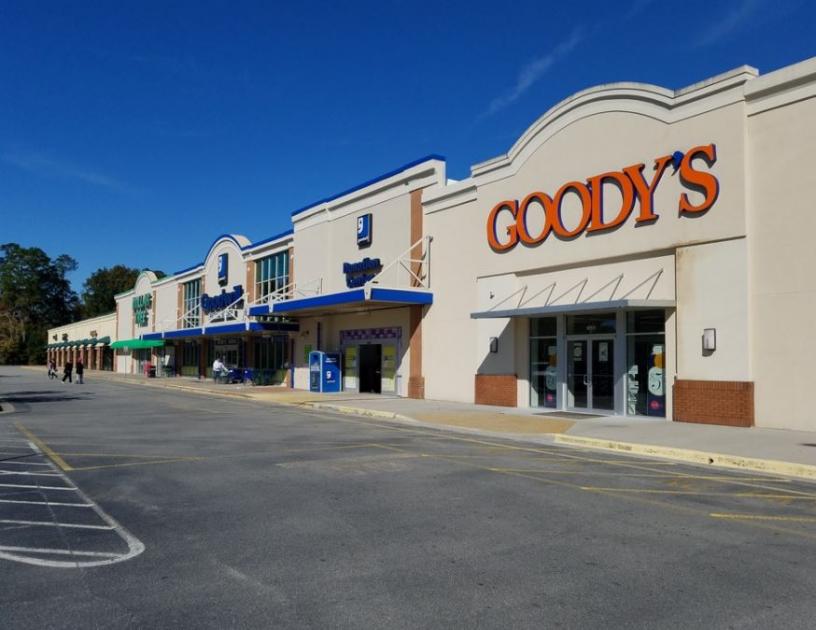
Details & Description
Property Highlights
- • Two I-95 Exits within one mile. Exit 87 Exit 90
- • Convenient to Savannah Hinesville Ft. Stewart
- • Main Main Location
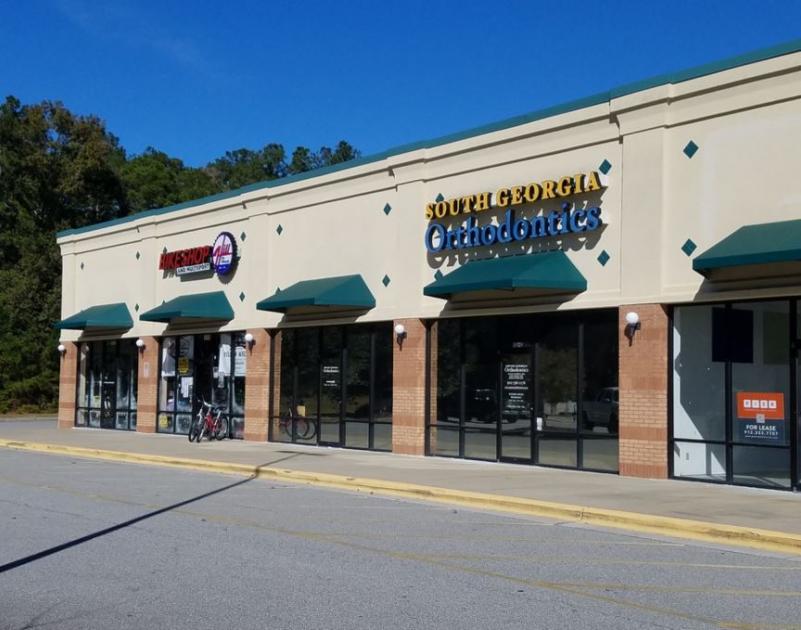
Additional Photos


Listing Agents

Joel Boblasky
O: 912-353-7707
joel@piercommercial.com
O: 912-353-7707
joel@piercommercial.com

Sharon Schneider
Pier CRE
O: 912-353-7707
sharon@piercommercial.com
Pier CRE
O: 912-353-7707
sharon@piercommercial.com
While we strive to provide the most accurate information, all listing information, and demographic data, is provided by third-parties. As such, MyEListing will not be responsible for the accuracy of the information. It is strongly recommended that you verify all information with the listing agent, and any relevant agencies, prior to making any decisions.


