Industrial Properties
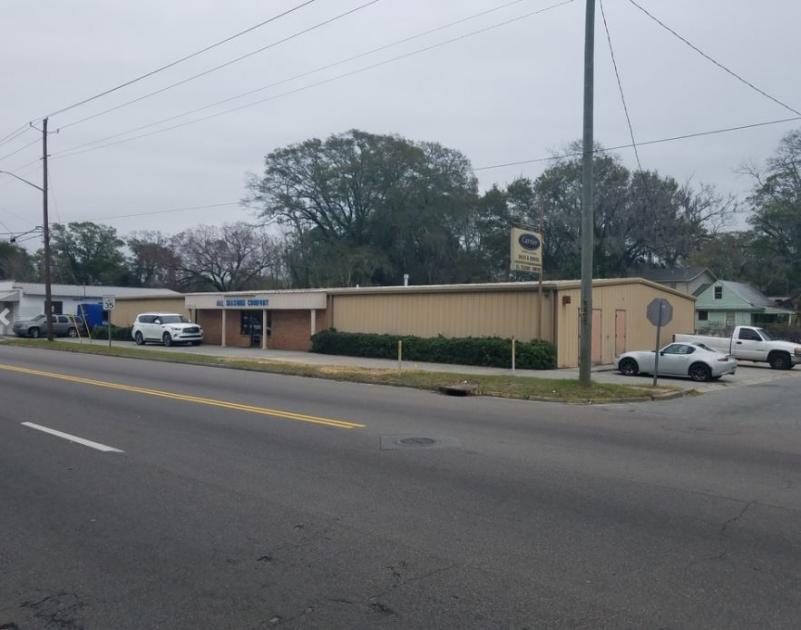
3912 Montgomery Street Savannah, GA 31405
3912 Montgomery Street Savannah, GA 31405
Details & Description
Property Highlights
- • Montgomery Street Frontage
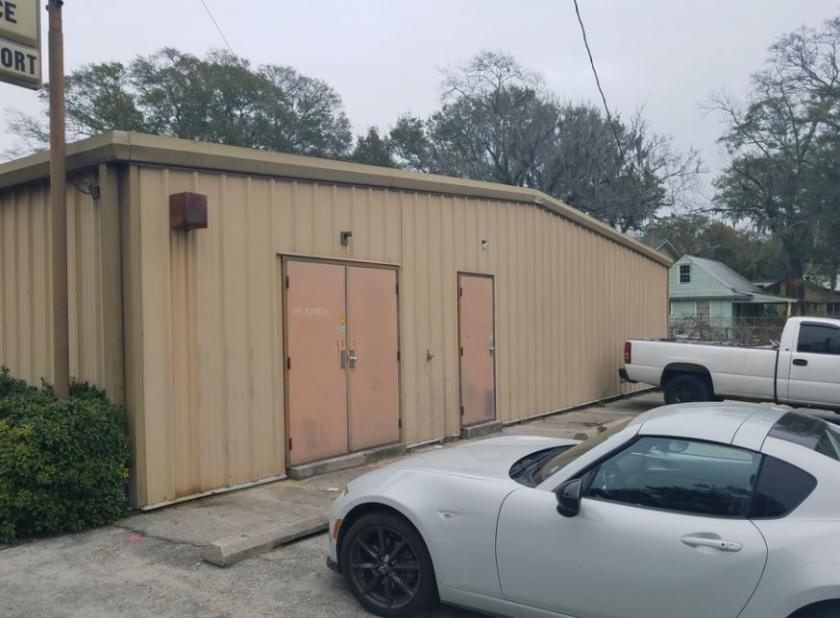
- • Roll up rear door
- • Central Location to Supply Houses.
- • 1500 sf of Condition Office Space
- • Secure Lay down yard.
Additional Photos


Listing Agents

Joel Boblasky
O: 912-353-7707
joel@piercommercial.com
O: 912-353-7707
joel@piercommercial.com

Sharon Schneider
Pier CRE
O: 912-353-7707
sharon@piercommercial.com
Pier CRE
O: 912-353-7707
sharon@piercommercial.com
While we strive to provide the most accurate information, all listing information, and demographic data, is provided by third-parties. As such, MyEListing will not be responsible for the accuracy of the information. It is strongly recommended that you verify all information with the listing agent, and any relevant agencies, prior to making any decisions.


