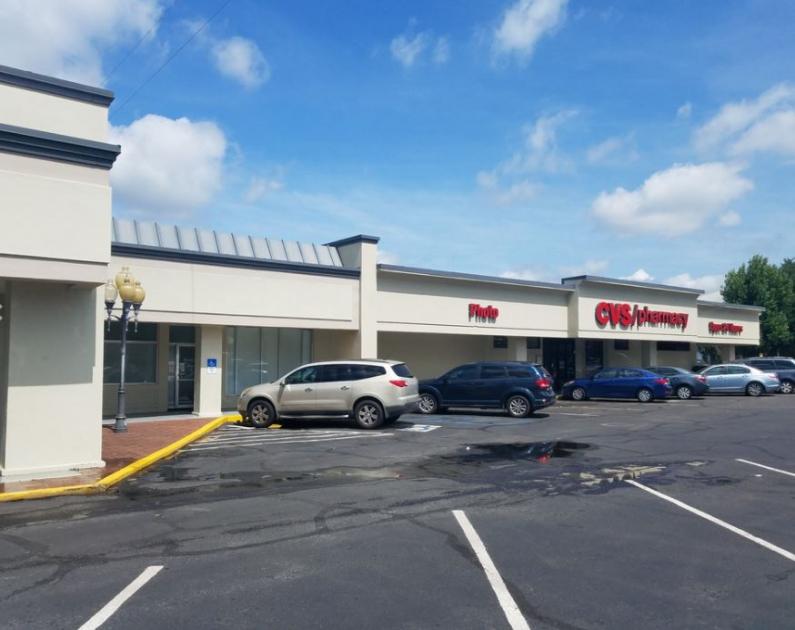
Office Space
4711 Waters Avenue Savannah, GA 31404
4711 Waters Avenue Savannah, GA 31404
Details & Description
Property Highlights
• Medical Arts - Largest concentration of Medical Services in Chatham County
• Located between HCA Memorial Hospital St. JosephCandler.
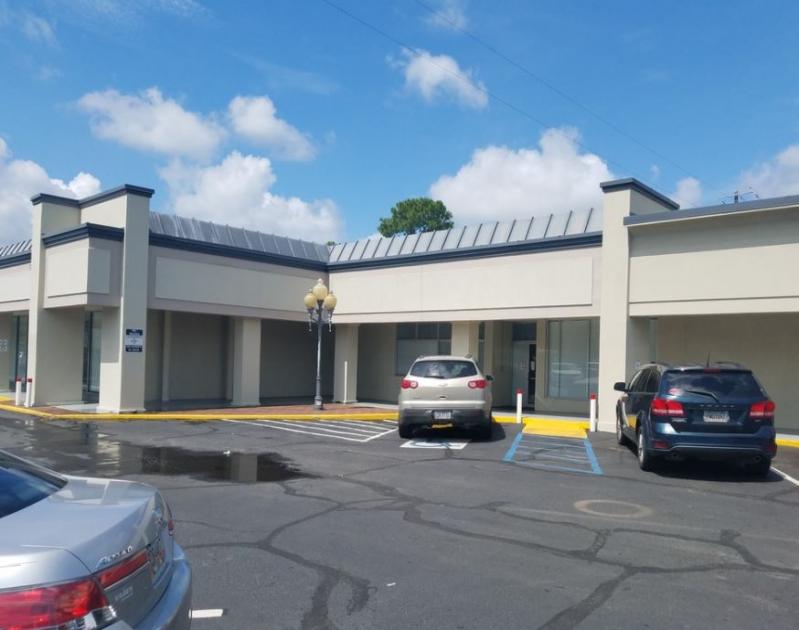
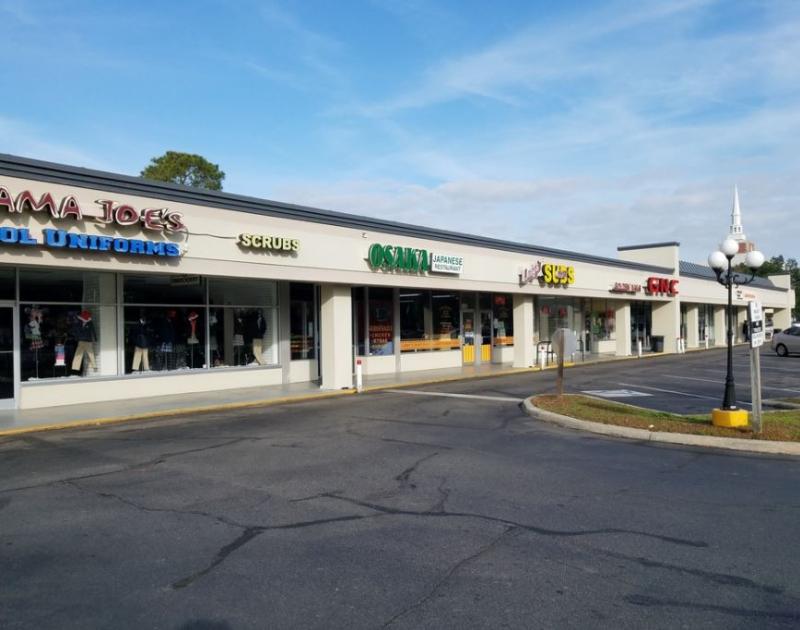
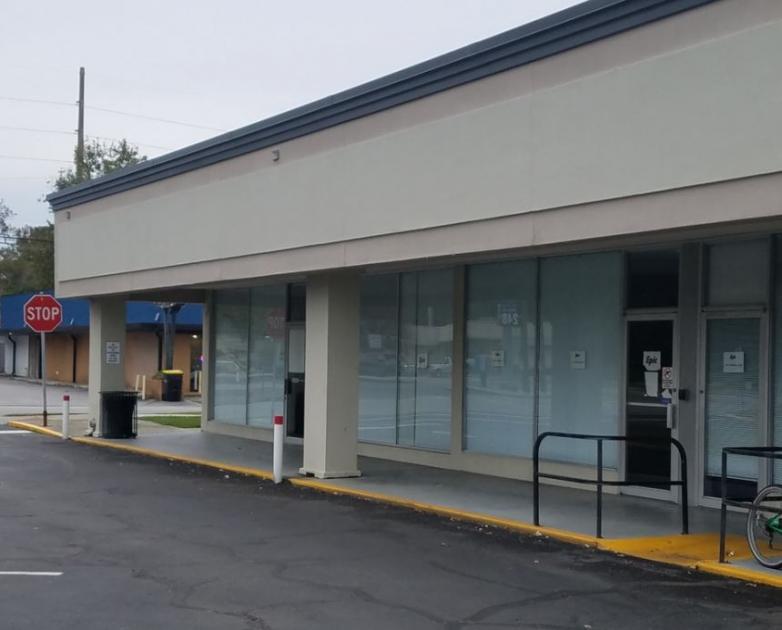
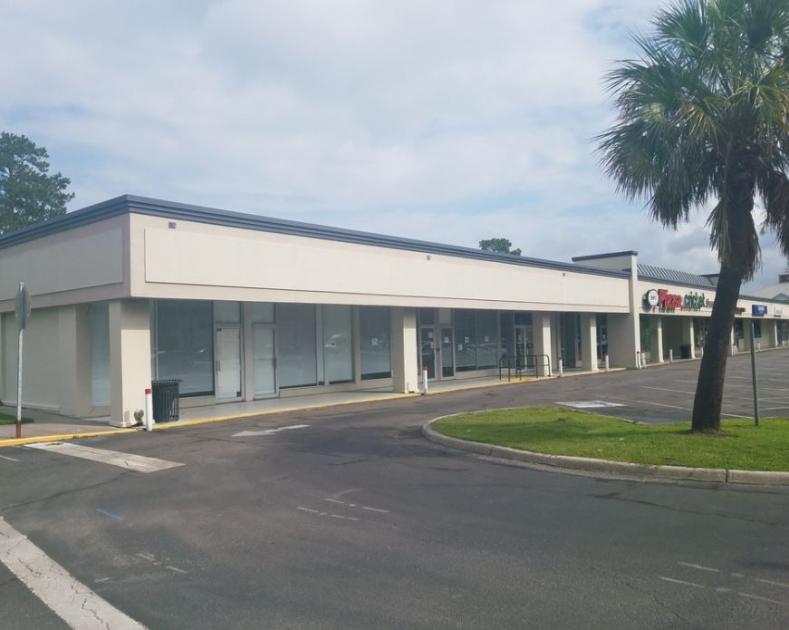
Additional Photos
Listing Agents

Joel Boblasky
O: 912-353-7707
joel@piercommercial.com
O: 912-353-7707
joel@piercommercial.com

Sharon Schneider
Pier CRE
O: 912-353-7707
sharon@piercommercial.com
Pier CRE
O: 912-353-7707
sharon@piercommercial.com
While we strive to provide the most accurate information, all listing information, and demographic data, is provided by third-parties. As such, MyEListing will not be responsible for the accuracy of the information. It is strongly recommended that you verify all information with the listing agent, and any relevant agencies, prior to making any decisions.


