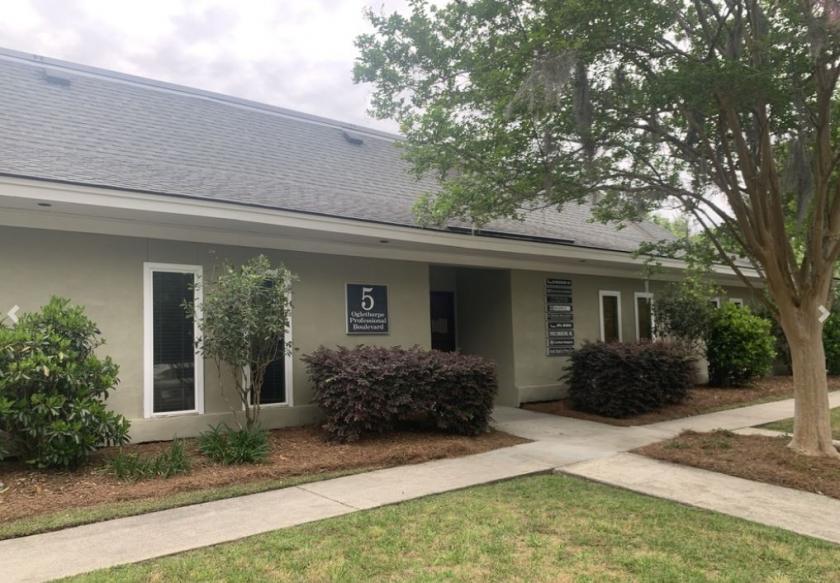
Office Space
5 Oglethorpe Professional Boulevard Savannah, GA 31406
5 Oglethorpe Professional Boulevard Savannah, GA 31406
Details & Description
Property Highlights
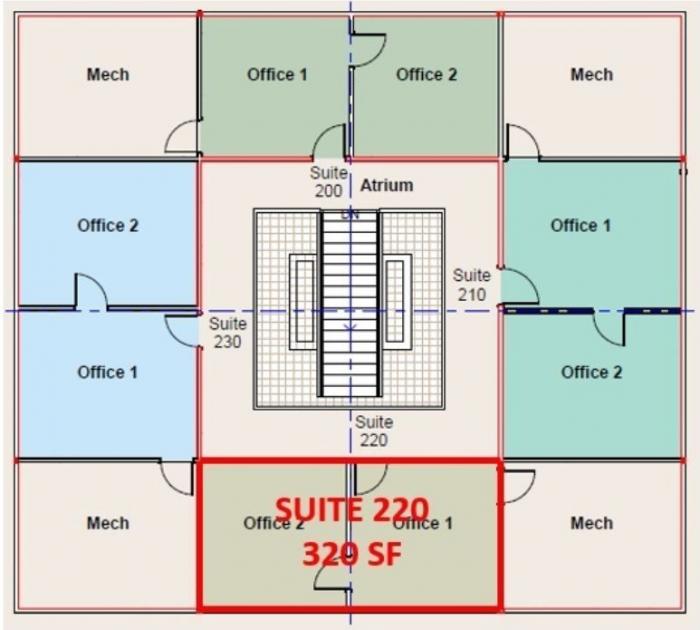
- • Multiple, flexible office layouts available
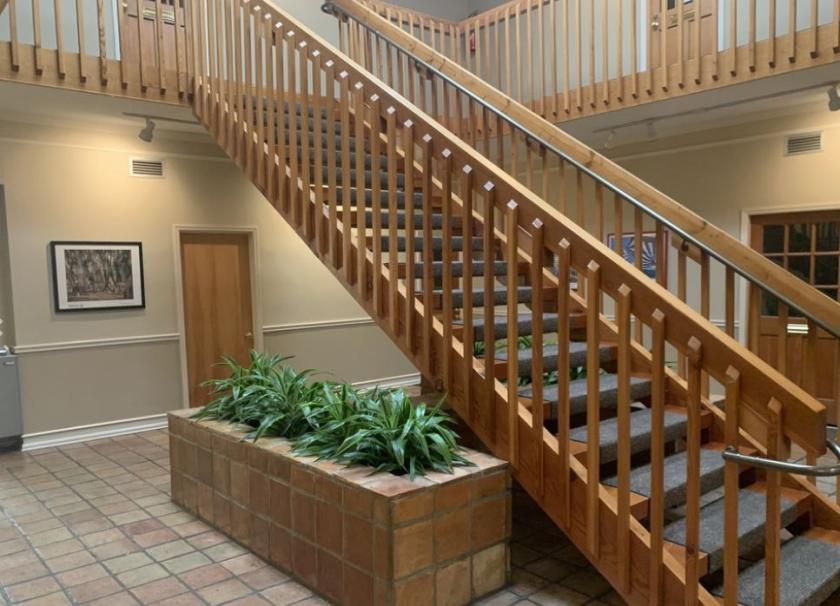
- • Shared kitchenette and break room
- • Ground floor space available
- • Gross lease terms
Additional Photos

Listing Agents

Anthony Wagner
O: 912-353-7707
anthony@piercommercial.com
O: 912-353-7707
anthony@piercommercial.com

Sharon Schneider
Pier CRE
O: 912-353-7707
sharon@piercommercial.com
Pier CRE
O: 912-353-7707
sharon@piercommercial.com
While we strive to provide the most accurate information, all listing information, and demographic data, is provided by third-parties. As such, MyEListing will not be responsible for the accuracy of the information. It is strongly recommended that you verify all information with the listing agent, and any relevant agencies, prior to making any decisions.


