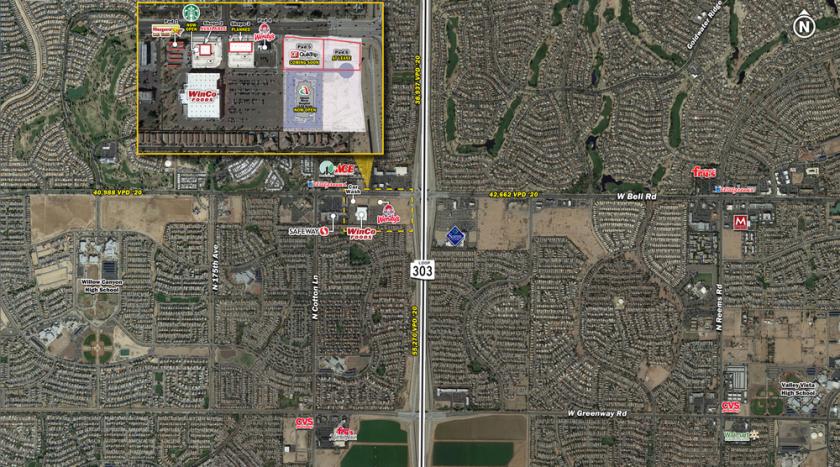
1-Mile | 3-Miles | 5-Miles | ||
---|---|---|---|---|
Total Population | 15,275 | 76,031 | 147,107 | |
Population Median Age | 40 | 44 | 45 | |
Population by Age | 0-9 Yrs | 2167 (14%) | 8308 (10%) | 15481 (10%) |
10-19 Yrs | 2592 (16%) | 10638 (13%) | 19251 (13%) | |
20-29 Yrs | 1062 (6%) | 6501 (8%) | 13155 (8%) | |
30-39 Yrs | 1888 (12%) | 7957 (10%) | 15314 (10%) | |
40-49 Yrs | 2253 (14%) | 9622 (12%) | 17681 (12%) | |
50-59 Yrs | 1226 (8%) | 6953 (9%) | 14739 (10%) | |
60-69 Yrs | 1572 (10%) | 9778 (12%) | 18434 (12%) | |
70+ Yrs | 2516 (16%) | 16274 (21%) | 33051 (22%) | |
Median HH Income | $66,844 | $71,078 | $67,614 | |
Total Household Income | < 24K | 513 (9%) | 2766 (9%) | 6804 (12%) |
25-49K | 1085 (20%) | 6072 (21%) | 12474 (22%) | |
50-74K | 1376 (26%) | 6280 (22%) | 12315 (21%) | |
75-99K | 956 (18%) | 5378 (18%) | 9607 (17%) | |
100-199K | 1112 (21%) | 6874 (24%) | 13182 (23%) | |
200K+ | 168 (3%) | 988 (3%) | 2026 (3%) | |
Highest Education Level | No Diploma | 624 | 3306 | 6933 |
Diploma or GED | 2421 | 13233 | 26596 | |
Some College | 2944 | 15360 | 30865 | |
Assoc. Degree | 828 | 5161 | 10164 | |
Bachelors Degree | 2236 | 11012 | 20057 | |
Higher Degree | 968 | 5732 | 11255 | |
Total Housing Units | 6,508 | 33,655 | 65,601 | |
--Owner-Occupied | 4,162 | 22,647 | 44,343 | |
--Renter-Occupied | 1,047 | 5,711 | 12,067 | |
Owner-Occupied Values | < 100K | 152 | 529 | 1631 |
100-199K | 1162 | 5477 | 11681 | |
200-299K | 2071 | 10493 | 20183 | |
300-399K | 668 | 4205 | 7724 | |
400-499K | 49 | 973 | 1807 | |
500K+ | 60 | 970 | 1317 | |
Total Working Age Population | 11,358 | 60,731 | 119,017 | |
In Work Force | 6,067 | 30,338 | 59,062 | |
Not In Work Force | 5,291 | 30,393 | 59,955 | |
Workforce Employed | 5,643 | 28,281 | 54,979 | |
Workforce Unemployed | 349 | 1,602 | 3,283 | |
Civlian Workforce | 5,992 | 29,883 | 58,261 | |
Military Workforce | 75 | 455 | 801 | |
Total Households | 5,210 | 28,357 | 56,410 | |
Family Households | 4,088 | 21,352 | 40,576 | |
Non-Family Households | 1,122 | 7,005 | 15,834 | |
Married Couple | 3,433 | 18,153 | 33,765 | |
Other Family | 655 | 3,199 | 6,810 | |
Married w/Child | 1,383 | 5,536 | 10,064 | |
Single Male w/Child | 123 | 450 | 922 | |
Single Female w/Child | 303 | 1,440 | 2,692 |
Population Change Last Two Decades - Plus Projection
2000 | % | 2010 | % | 2020 | % | 2030 | |
---|---|---|---|---|---|---|---|
Arizona | 5,130,632 | +25 | 6,392,017 | +14 | 7,286,100 | +14 | 8,284,900 |
Maricopa County | 3,072,149 | +24 | 3,817,117 | +16 | 4,436,900 | +15 | 5,107,700 |
Total Working Age Population:
Total Households:
Total Working Age Population:
Total Households:
Total Working Age Population:
Total Households: