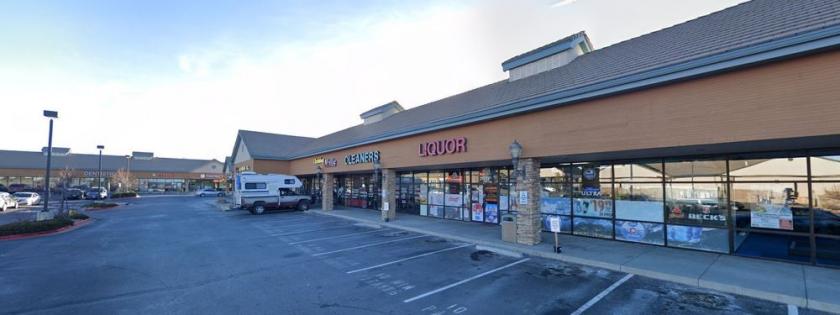
Retail Space
22902 East Smoky Hill Road Aurora, CO 80016
22902 East Smoky Hill Road Aurora, CO 80016

Details & Description
Property Highlights
- • Strong neighborhood center
- • Strong household incomes
- • Monument signage available on Smoky Hill Road
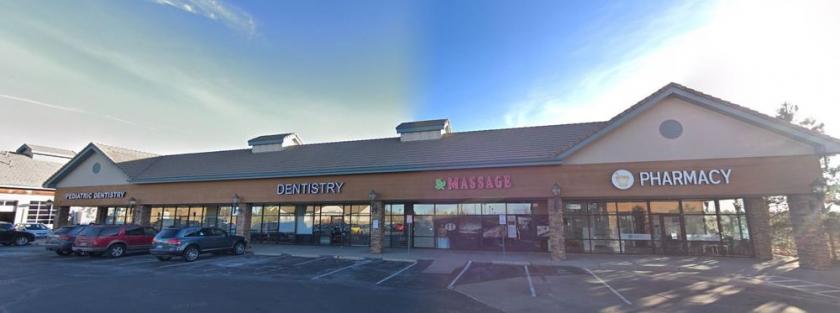
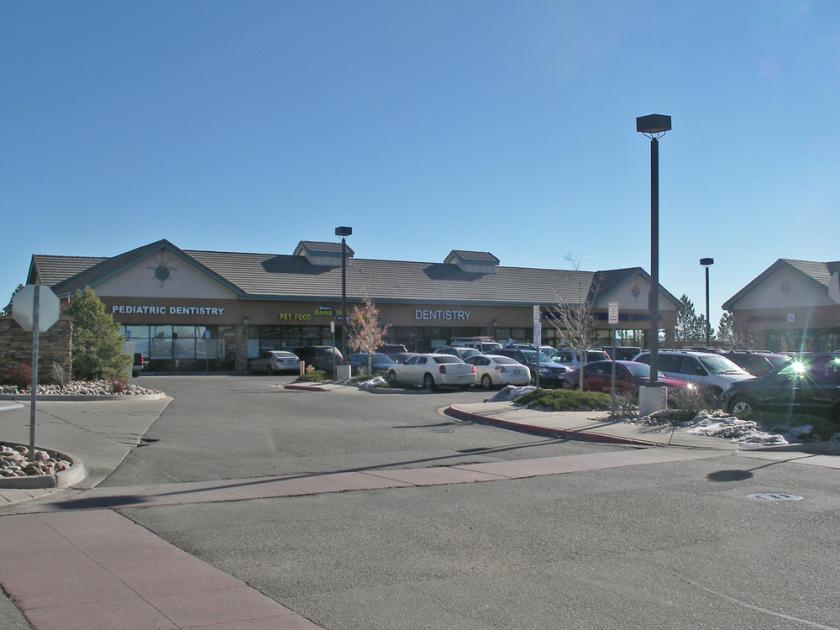
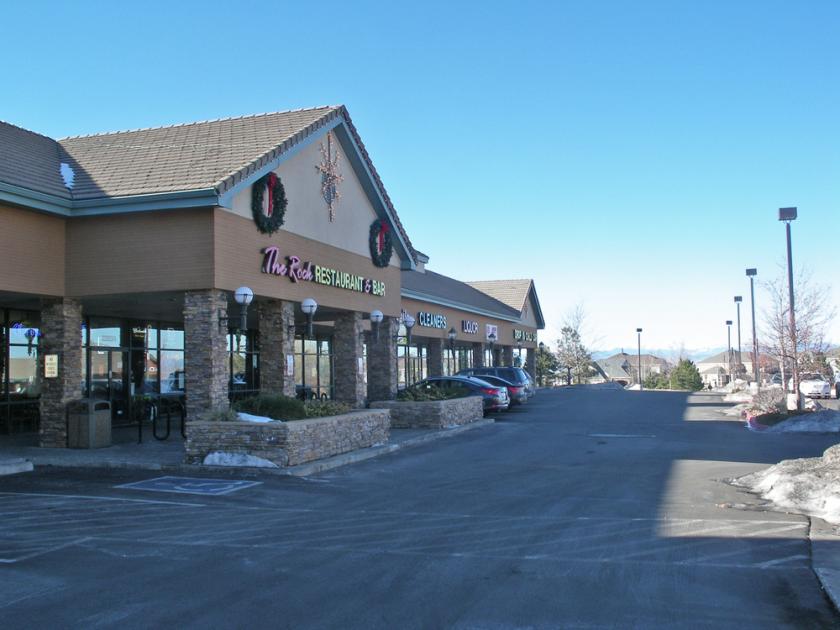
Additional Photos
Listing Agents

Tony Pierangeli
O: 303-390-5257
M: 303-324-2044
tony.pierangeli@srsre.com
O: 303-390-5257
M: 303-324-2044
tony.pierangeli@srsre.com
While we strive to provide the most accurate information, all listing information, and demographic data, is provided by third-parties. As such, MyEListing will not be responsible for the accuracy of the information. It is strongly recommended that you verify all information with the listing agent, and any relevant agencies, prior to making any decisions.


