Commercial Land
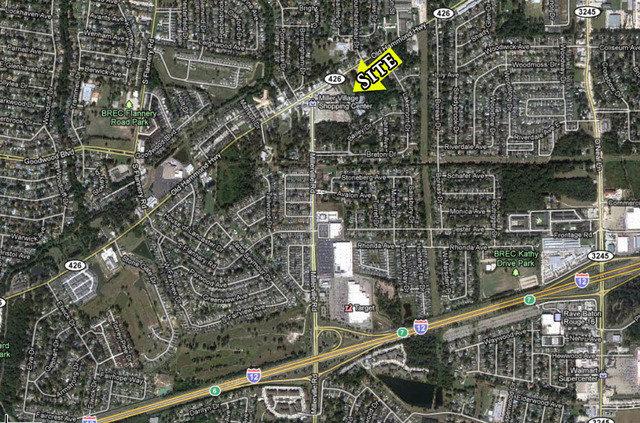
1000 Millerville Road Baton Rouge, LA 70816
1000 Millerville Road Baton Rouge, LA 70816
Details & Description
Property Highlights
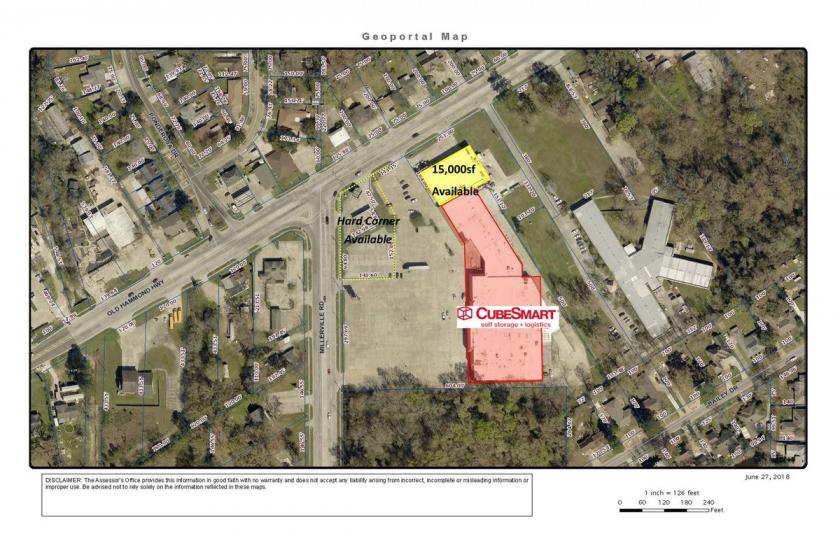
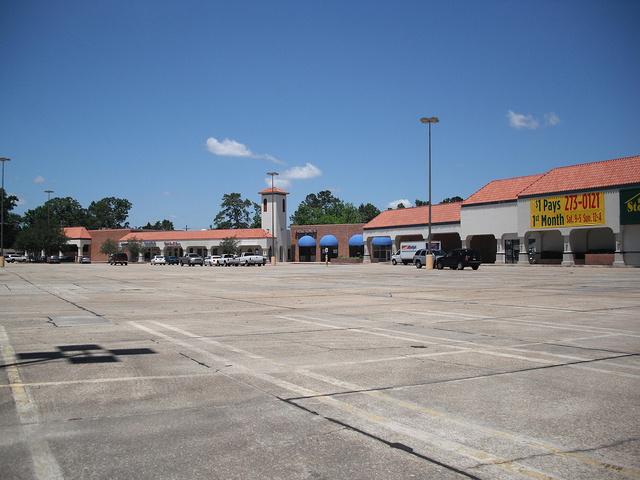
• Outparcels available including HARD CORNER. Sale or build to suit.
• Contact agents for more information.
Listing Agents

Colin Smith
O: 225-925-0600
colin@kurzhebert.com
O: 225-925-0600
colin@kurzhebert.com
While we strive to provide the most accurate information, all listing information, and demographic data, is provided by third-parties. As such, MyEListing will not be responsible for the accuracy of the information. It is strongly recommended that you verify all information with the listing agent, and any relevant agencies, prior to making any decisions.