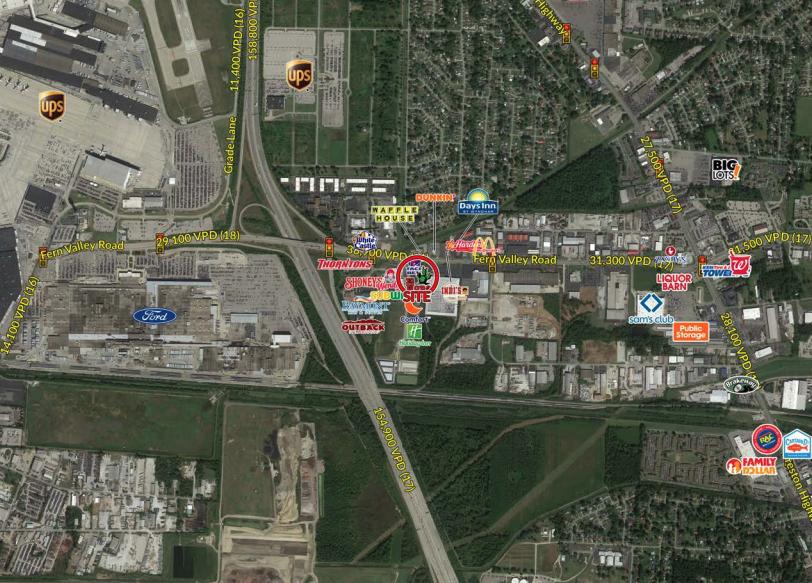
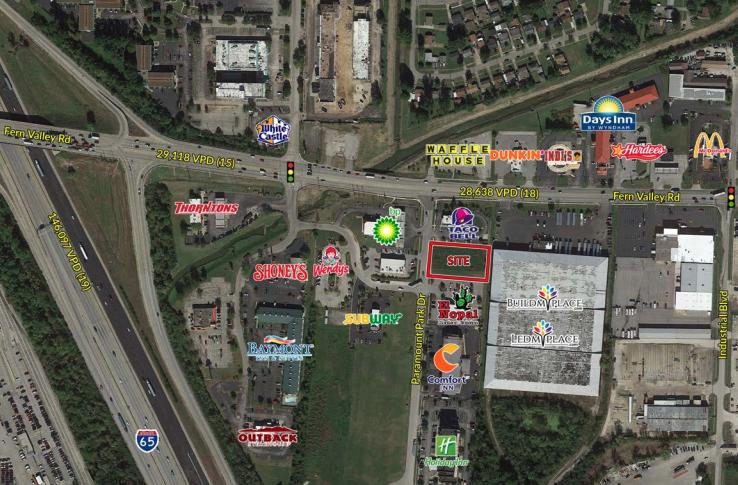
1-Mile | 3-Miles | 5-Miles | ||
---|---|---|---|---|
Total Population | 4,107 | 51,955 | 201,438 | |
Population Median Age | 39 | 37 | 38 | |
Population by Age | 0-9 Yrs | 447 (10%) | 6936 (13%) | 26602 (13%) |
10-19 Yrs | 493 (12%) | 6555 (12%) | 23881 (11%) | |
20-29 Yrs | 612 (14%) | 8254 (15%) | 30626 (15%) | |
30-39 Yrs | 521 (12%) | 7132 (13%) | 28442 (14%) | |
40-49 Yrs | 652 (15%) | 6508 (12%) | 25343 (12%) | |
50-59 Yrs | 495 (12%) | 6675 (12%) | 26423 (13%) | |
60-69 Yrs | 456 (11%) | 5166 (9%) | 21799 (10%) | |
70+ Yrs | 432 (10%) | 4728 (9%) | 18321 (9%) | |
Median HH Income | $35,501 | $43,873 | $49,772 | |
Total Household Income | < 24K | 699 (37%) | 5134 (25%) | 17850 (22%) |
25-49K | 534 (28%) | 6543 (32%) | 21979 (27%) | |
50-74K | 330 (17%) | 3988 (19%) | 15504 (19%) | |
75-99K | 104 (5%) | 2259 (11%) | 10372 (13%) | |
100-199K | 179 (9%) | 1928 (9%) | 11672 (14%) | |
200K+ | 22 (1%) | 391 (1%) | 1906 (2%) | |
Highest Education Level | No Diploma | 472 | 5108 | 16411 |
Diploma or GED | 1328 | 12806 | 44010 | |
Some College | 595 | 7849 | 31481 | |
Assoc. Degree | 255 | 3108 | 12119 | |
Bachelors Degree | 184 | 3850 | 20670 | |
Higher Degree | 83 | 1623 | 12100 | |
Total Housing Units | 1,987 | 22,506 | 88,052 | |
--Owner-Occupied | 807 | 10,024 | 46,438 | |
--Renter-Occupied | 1,062 | 10,218 | 32,845 | |
Owner-Occupied Values | < 100K | 513 | 4028 | 12158 |
100-199K | 277 | 5461 | 25288 | |
200-299K | 9 | 382 | 5663 | |
300-399K | 4 | 72 | 2066 | |
400-499K | 0 | 10 | 541 | |
500K+ | 3 | 71 | 722 | |
Total Working Age Population | 3,374 | 40,913 | 160,681 | |
In Work Force | 2,204 | 26,956 | 107,168 | |
Not In Work Force | 1,170 | 13,957 | 53,513 | |
Workforce Employed | 2,142 | 25,326 | 100,812 | |
Workforce Unemployed | 61 | 1,591 | 6,225 | |
Civlian Workforce | 2,203 | 26,917 | 107,037 | |
Military Workforce | 1 | 39 | 131 | |
Total Households | 1,869 | 20,242 | 79,283 | |
Family Households | 959 | 12,351 | 47,748 | |
Non-Family Households | 910 | 7,891 | 31,535 | |
Married Couple | 528 | 7,095 | 30,373 | |
Other Family | 431 | 5,256 | 17,375 | |
Married w/Child | 165 | 2,713 | 11,444 | |
Single Male w/Child | 28 | 580 | 1,911 | |
Single Female w/Child | 184 | 2,040 | 6,531 |
Population Change Last Two Decades - Plus Projection
2000 | % | 2010 | % | 2020 | % | 2030 | |
---|---|---|---|---|---|---|---|
Indiana | 6,080,485 | +7 | 6,483,802 | +4 | 6,738,573 | +4 | 7,014,880 |
Floyd County | 70,823 | +5 | 74,578 | +6 | 78,826 | +3 | 81,345 |
Kentucky | 4,041,769 | +7 | 4,339,367 | +4 | 4,533,464 | +4 | 4,726,382 |
Bullitt County | 61,236 | +21 | 74,319 | +12 | 83,186 | +10 | 91,527 |
Jefferson County | 693,604 | +7 | 741,096 | +7 | 790,010 | +6 | 837,477 |
Total Working Age Population:
Total Households:
Total Working Age Population:
Total Households:
Total Working Age Population:
Total Households: