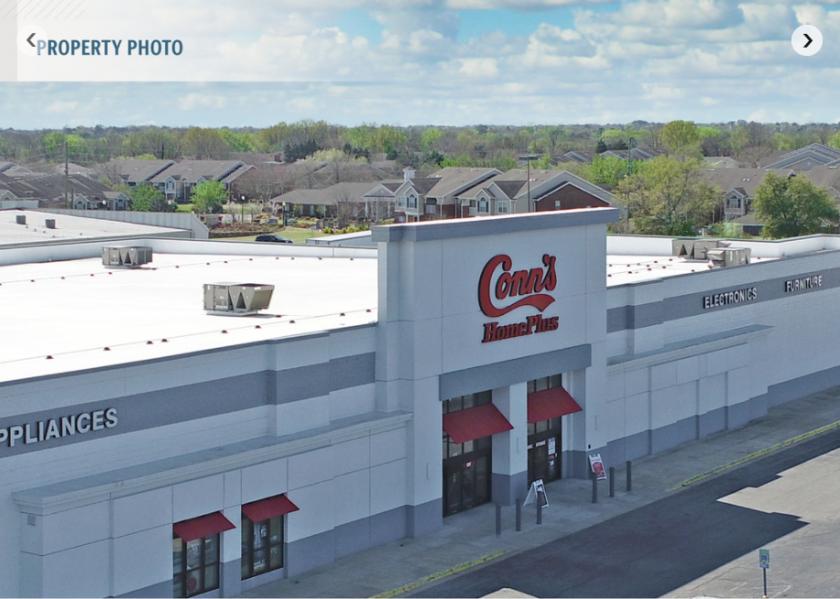
SRS National Net Lease Group is pleased to offer the opportunity to acquire the fee simple interest (land and building) in a NNN leased, corporate guaranteed, Conn’s HomePlus investment property located in Montgomery, Alabama. The tenant, Conn’s Appliances, Inc., has approximately 8 years remaining in their initial term with 4 (5-year) options to extend. The lease features a 10% rental increase in year 6 of the initial term and at the beginning of the first three option periods, as well as rental adjustment based on fair market value at the beginning of the fourth option period, growing NOI and hedging against inflation. The lease is guaranteed by Conn’s Inc. (NASDAQ: CONN) and is NNN with limited landlord responsibilities, making it an ideal, low-management investment opportunity for a passive investor.Conn’s HomePlus is strategically located along Eastern Blvd/State Highway 8 & 53, a major commuter/retail thoroughfare averaging 50,000 vehicles passing by daily. The site benefits from excellent visibility via a large monument sign along Eastern Blvd as well as easy access via 4 separate points of ingress/egress. Additionally, the asset is nearby to the on/off ramps of Interstate 85 (106,900 VPD), the primary thoroughfare traveling through the city of Montgomery. Conn’s is a junior anchor to Promenade Montgomery and Promenade Montgomery North, two community centers totaling approximately 270,000 SF of retail space, with notable tenants including The Home Depot, Harbor Freight Tools, Winn-Dixie, Dollar Tree, Goody’s, and more, increasing consumer draw and promoting crossover traffic to the site. The centers are positioned within an extremely dense retail corridor serving the city of Montgomery, with other nearby national/credit tenants including 3 Walmart Supercenters, Walmart Neighborhood Market, Lowe’s Home Improvement, ALDI, Sam’s Club and more, further increasing consumer draw. The 5-mile trade area is supported by more than 154,000 residents and 87,000 daytime employees with an average household income of $76,256.