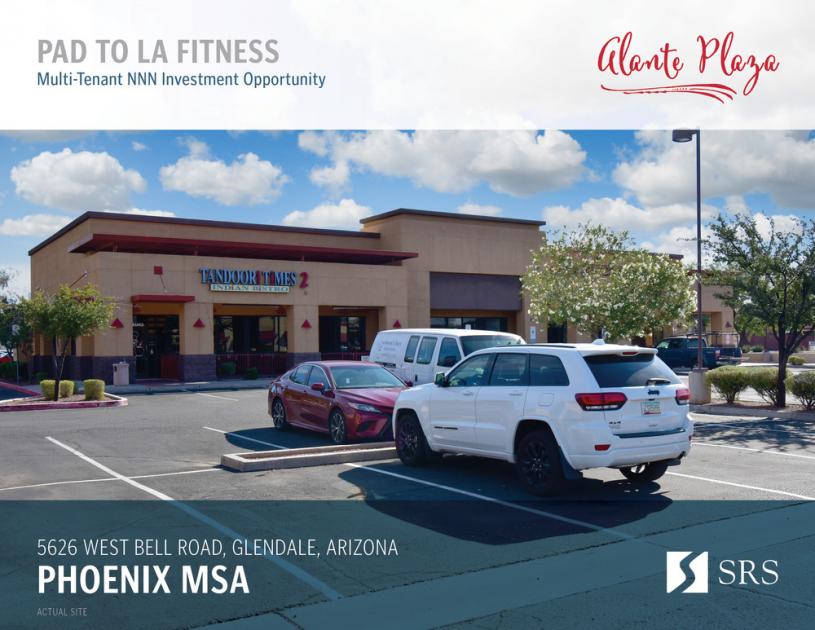
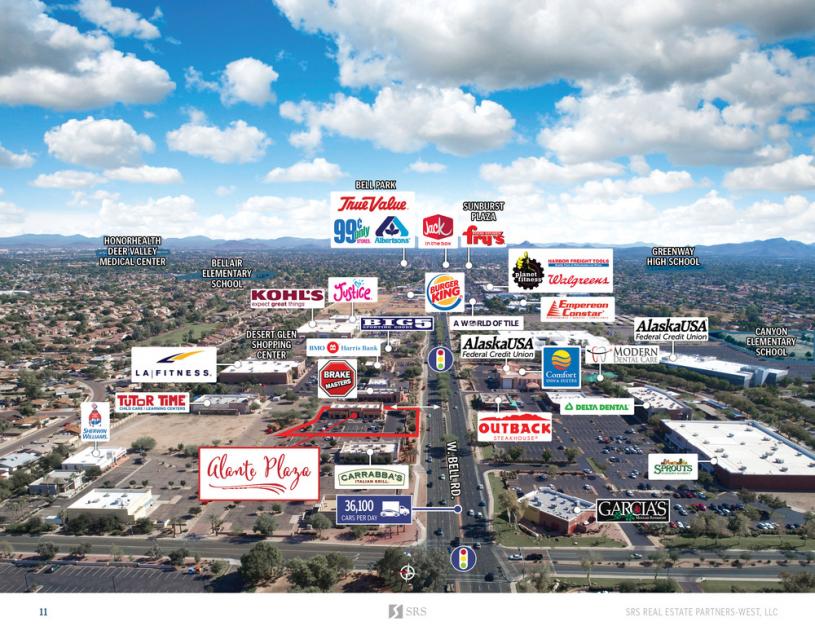
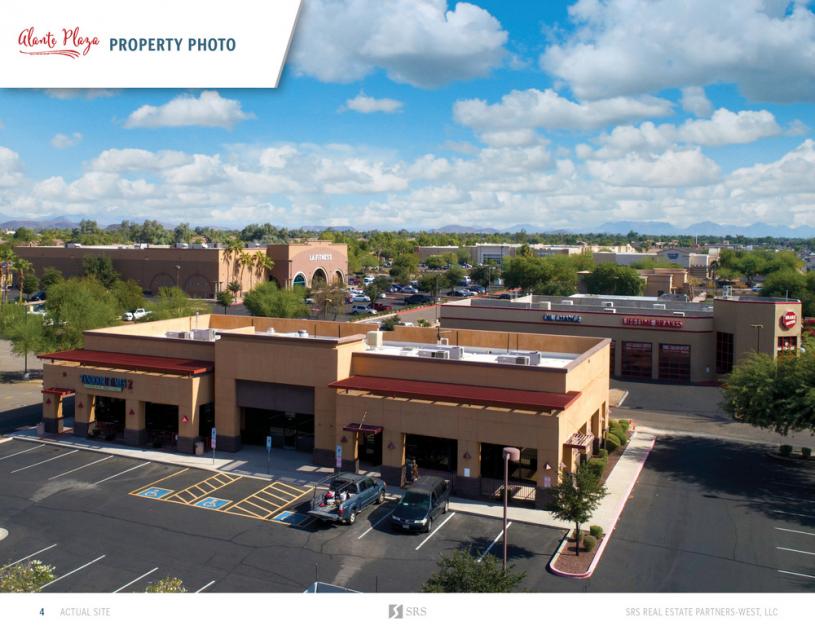
1-Mile | 3-Miles | 5-Miles | ||
---|---|---|---|---|
Total Population | 11,128 | 115,882 | 338,024 | |
Population Median Age | 40 | 40 | 39 | |
Population by Age | 0-9 Yrs | 1310 (11%) | 11712 (10%) | 39864 (11%) |
10-19 Yrs | 1337 (12%) | 14720 (12%) | 41750 (12%) | |
20-29 Yrs | 1263 (11%) | 17176 (14%) | 49417 (14%) | |
30-39 Yrs | 1796 (16%) | 14833 (12%) | 43739 (12%) | |
40-49 Yrs | 1275 (11%) | 14930 (12%) | 43875 (12%) | |
50-59 Yrs | 1642 (14%) | 17205 (14%) | 47676 (14%) | |
60-69 Yrs | 1329 (11%) | 14139 (12%) | 37893 (11%) | |
70+ Yrs | 1174 (10%) | 11168 (9%) | 33810 (10%) | |
Median HH Income | $76,421 | $71,733 | $65,804 | |
Total Household Income | < 24K | 428 (11%) | 5922 (14%) | 18431 (15%) |
25-49K | 699 (18%) | 8263 (19%) | 26555 (21%) | |
50-74K | 681 (18%) | 7794 (18%) | 24686 (20%) | |
75-99K | 707 (19%) | 6818 (16%) | 18831 (15%) | |
100-199K | 1029 (27%) | 10924 (25%) | 28312 (23%) | |
200K+ | 153 (4%) | 2319 (5%) | 5919 (4%) | |
Highest Education Level | No Diploma | 656 | 6440 | 21349 |
Diploma or GED | 2008 | 19907 | 61038 | |
Some College | 2205 | 22728 | 62164 | |
Assoc. Degree | 1016 | 8662 | 23620 | |
Bachelors Degree | 1322 | 15288 | 42845 | |
Higher Degree | 740 | 8612 | 22487 | |
Total Housing Units | 3,981 | 45,269 | 133,604 | |
--Owner-Occupied | 3,071 | 28,173 | 81,113 | |
--Renter-Occupied | 626 | 13,868 | 41,620 | |
Owner-Occupied Values | < 100K | 133 | 1285 | 5594 |
100-199K | 894 | 6770 | 24764 | |
200-299K | 1343 | 11227 | 31101 | |
300-399K | 524 | 5253 | 11948 | |
400-499K | 161 | 2039 | 4189 | |
500K+ | 15 | 1600 | 3517 | |
Total Working Age Population | 9,077 | 95,857 | 274,096 | |
In Work Force | 5,882 | 62,941 | 179,139 | |
Not In Work Force | 3,195 | 32,917 | 94,957 | |
Workforce Employed | 5,577 | 59,887 | 170,131 | |
Workforce Unemployed | 295 | 2,979 | 8,582 | |
Civlian Workforce | 5,872 | 62,866 | 178,713 | |
Military Workforce | 10 | 75 | 426 | |
Total Households | 3,697 | 42,041 | 122,733 | |
Family Households | 2,784 | 28,207 | 82,333 | |
Non-Family Households | 913 | 13,835 | 40,400 | |
Married Couple | 2,130 | 20,761 | 59,052 | |
Other Family | 654 | 7,446 | 23,282 | |
Married w/Child | 704 | 7,010 | 21,719 | |
Single Male w/Child | 85 | 1,148 | 3,751 | |
Single Female w/Child | 122 | 2,176 | 7,334 |
Population Change Last Two Decades - Plus Projection
2000 | % | 2010 | % | 2020 | % | 2030 | |
---|---|---|---|---|---|---|---|
Arizona | 5,130,632 | +25 | 6,392,017 | +14 | 7,286,100 | +14 | 8,284,900 |
Maricopa County | 3,072,149 | +24 | 3,817,117 | +16 | 4,436,900 | +15 | 5,107,700 |
Total Working Age Population:
Total Households:
Total Working Age Population:
Total Households:
Total Working Age Population:
Total Households: