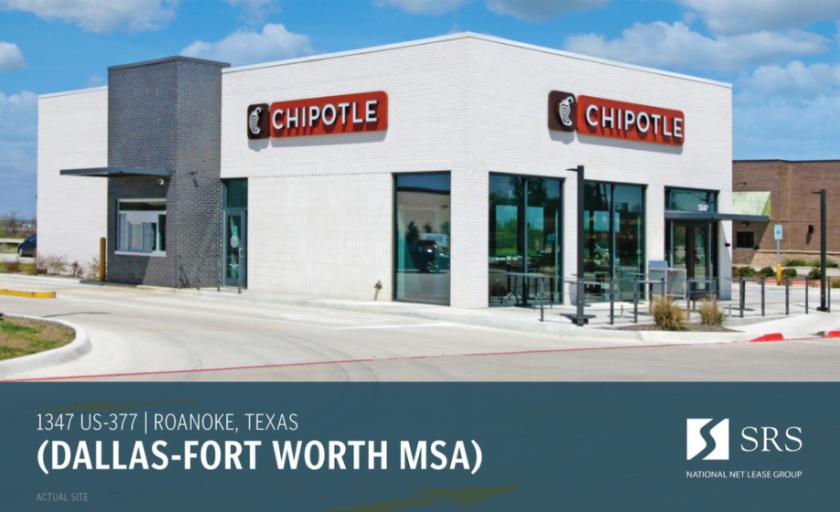
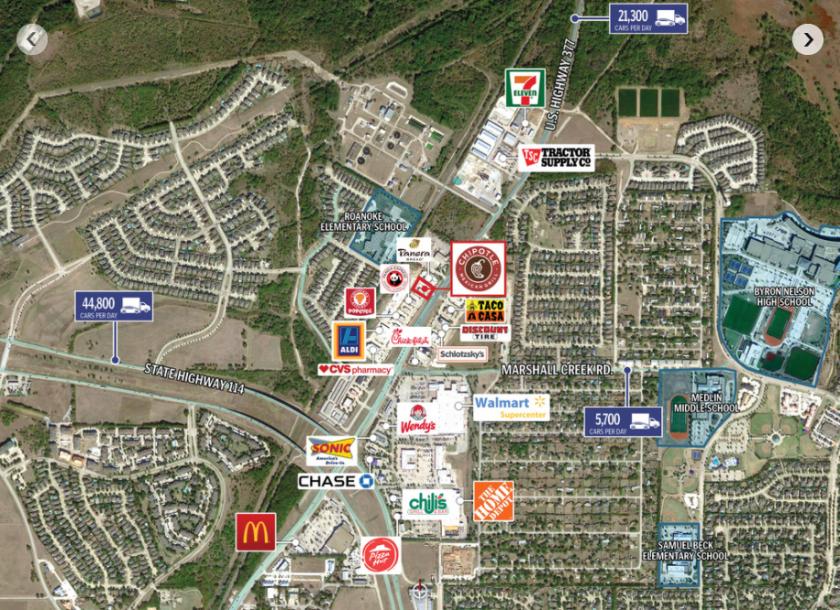
SRS National Net Lease Group is pleased to offer the opportunity to acquire the leased fee (land ownership) in an absolute NNN, corporate guaranteed, drive-thru equipped, Chipotle investment property located in Roanoke, Texas (Dallas-Fort Worth MSA). The tenant, Chipotle Mexican Grill, Inc., has over 18 years remaining in their initial term with 3 (5-year) options to extend, demonstrating their long-term commitment to the site. The lease features 10% rental increases every 5 years throughout the initial term and at the beginning of each option period, growing NOI and hedging against inflation. The lease is corporate guaranteed by Chipotle Mexican Grill, Inc., and is absolute NNN with zero landlord responsibilities. Chipotle Mexican Grill, Inc. is an established and nationally recognized brand with over 2,600 locations internationally.Chipotle is strategically located along U.S. Highway 377, averaging 21,300 combined vehicles passing by daily. The building is complete with a rare freestanding drive-thru “Chipotlane” concept, providing ease and convenience for customers and allowing the ability to accommodate a higher volume of mobile orders. The site is equipped with a large monument sign, creating excellent visibility along U.S. Highway 377. Chipotle benefits from nearby from nearby on/off ramp access to State Highway 114 (44,800 VPD), a major commuter thoroughfare that starts in the Dallas-Fort Worth Metroplex and travels westward directly through Roanoke. The asset is ideally situated less than 1 mile north of Roanoke Crossing, a 409,000 SF power center anchored by Walmart Supercenter and The Home Depot. U.S. Highway 377 is the primary retail corridor serving the trade area, with other nearby national/credit tenants including Aldi, Dollar Tree, Tractor Supply Co., McDonald’s, 7-Eleven, CVS Pharmacy, Chick-fil-A and more. Strong tenant synergy increases consumer draw to the immediate trade area and promotes crossover store exposure for Chipotle. Moreover, the asset is less than 4 miles east of Texas Motor Speedway, a 1,500-acre racing facility that holds multiple high-profile NASCAR and IndyCar events each year and has a seating capacity of over 181,000. Additionally, the site is surrounded by several apartment complexes including Copper Ridge Apartments (313 units), Boulder Ridge Apartments (494 units), and Chadwick Apartments (264 units), providing a direct residential consumer base from which to draw. The 5-mile trade area is supported by more than 66,000 residents and 15,600 daytime employees with an affluent average household income of over $146,000.