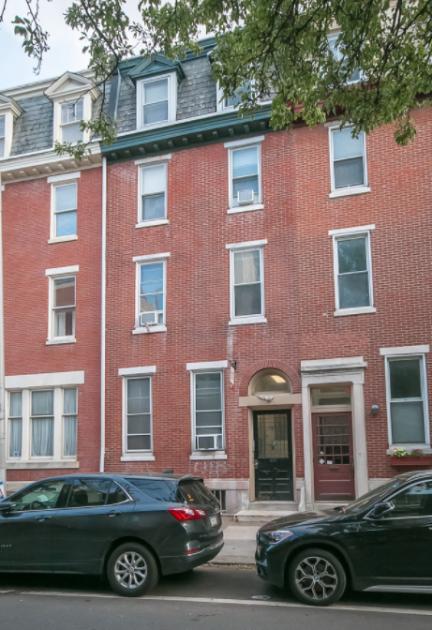
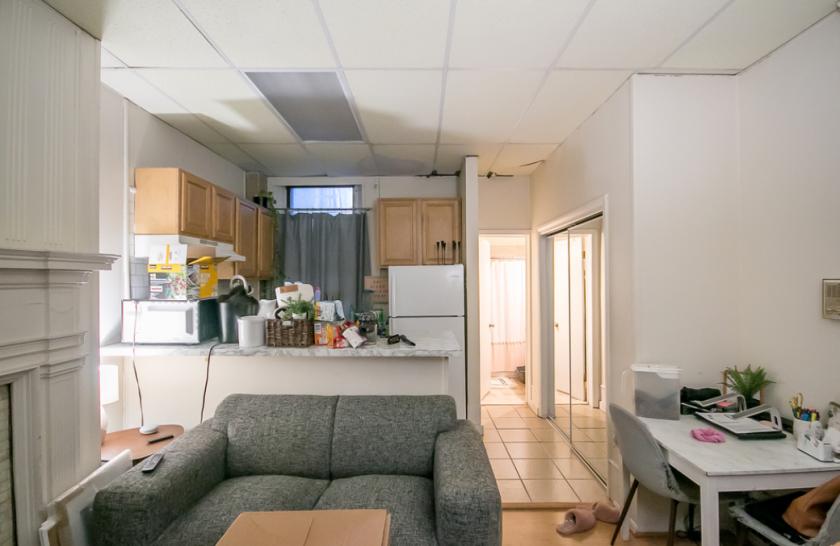
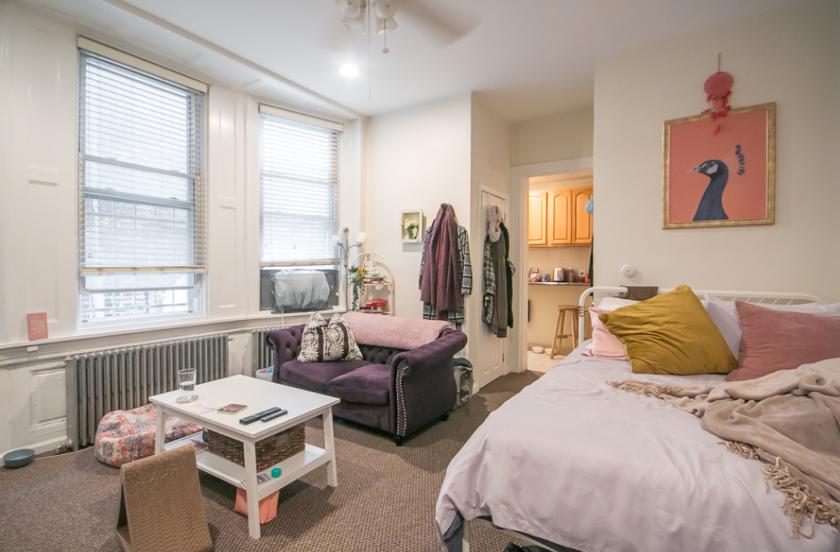
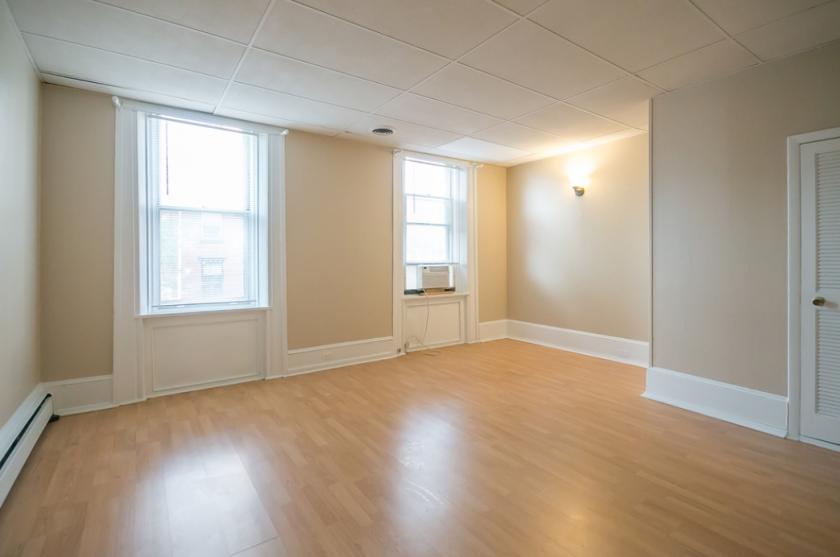
1-Mile | 3-Miles | 5-Miles | ||
---|---|---|---|---|
Total Population | 85,599 | 462,413 | 925,526 | |
Population Median Age | 38 | 36 | 36 | |
Population by Age | 0-9 Yrs | 5593 (6%) | 45553 (9%) | 113422 (12%) |
10-19 Yrs | 4514 (5%) | 49300 (10%) | 113230 (12%) | |
20-29 Yrs | 24136 (28%) | 107948 (23%) | 181057 (19%) | |
30-39 Yrs | 19727 (23%) | 86165 (18%) | 152406 (16%) | |
40-49 Yrs | 7964 (9%) | 45938 (9%) | 98436 (10%) | |
50-59 Yrs | 8106 (9%) | 46882 (10%) | 104090 (11%) | |
60-69 Yrs | 7971 (9%) | 42245 (9%) | 87643 (9%) | |
70+ Yrs | 7587 (8%) | 38382 (8%) | 75243 (8%) | |
Median HH Income | $78,663 | $54,652 | $42,769 | |
Total Household Income | < 24K | 8186 (18%) | 54140 (28%) | 121491 (33%) |
25-49K | 6402 (14%) | 36093 (18%) | 78875 (21%) | |
50-74K | 6715 (15%) | 29013 (15%) | 53746 (14%) | |
75-99K | 4904 (11%) | 20107 (10%) | 35168 (9%) | |
100-199K | 10682 (24%) | 36104 (18%) | 52897 (14%) | |
200K+ | 7156 (16%) | 17089 (8%) | 20144 (5%) | |
Highest Education Level | No Diploma | 3628 | 40808 | 102700 |
Diploma or GED | 7612 | 79094 | 188433 | |
Some College | 5913 | 42517 | 100003 | |
Assoc. Degree | 2000 | 13518 | 30020 | |
Bachelors Degree | 23377 | 78120 | 112635 | |
Higher Degree | 26052 | 70453 | 89569 | |
Total Housing Units | 50,764 | 224,928 | 426,227 | |
--Owner-Occupied | 17,225 | 84,227 | 168,631 | |
--Renter-Occupied | 26,819 | 108,318 | 193,691 | |
Owner-Occupied Values | < 100K | 832 | 13424 | 59407 |
100-199K | 1630 | 18256 | 43732 | |
200-299K | 2358 | 17197 | 24666 | |
300-399K | 3020 | 12312 | 15002 | |
400-499K | 2527 | 7452 | 8673 | |
500K+ | 6858 | 15587 | 17151 | |
Total Working Age Population | 78,187 | 393,939 | 749,198 | |
In Work Force | 55,450 | 251,741 | 452,569 | |
Not In Work Force | 22,737 | 142,198 | 296,628 | |
Workforce Employed | 53,256 | 232,975 | 411,542 | |
Workforce Unemployed | 2,148 | 18,585 | 40,809 | |
Civlian Workforce | 55,405 | 251,560 | 452,352 | |
Military Workforce | 45 | 181 | 218 | |
Total Households | 44,045 | 192,545 | 362,322 | |
Family Households | 14,021 | 82,398 | 180,599 | |
Non-Family Households | 30,024 | 110,148 | 181,723 | |
Married Couple | 10,896 | 47,870 | 84,535 | |
Other Family | 3,124 | 34,528 | 96,064 | |
Married w/Child | 3,045 | 16,146 | 30,111 | |
Single Male w/Child | 240 | 2,797 | 8,084 | |
Single Female w/Child | 1,042 | 12,750 | 38,327 |
Population Change Last Two Decades - Plus Projection
2000 | % | 2010 | % | 2020 | % | 2030 | |
---|---|---|---|---|---|---|---|
New Jersey | 8,414,350 | +4 | 8,791,894 | +4 | 9,132,700 | +4 | 9,530,900 |
Camden County | 508,932 | +1 | 513,657 | 0 | 511,800 | +2 | 521,000 |
Gloucester County | 254,673 | +13 | 288,288 | +1 | 292,000 | +5 | 305,800 |
Pennsylvania | 12,281,054 | +3 | 12,702,379 | +4 | 13,230,170 | +4 | 13,759,594 |
Delaware County | 550,864 | +1 | 558,979 | +5 | 588,436 | +6 | 622,307 |
Montgomery County | 750,097 | +7 | 799,874 | +5 | 838,883 | +6 | 891,868 |
Philadelphia County | 1,517,550 | +1 | 1,526,006 | +8 | 1,653,729 | +6 | 1,753,054 |
Total Working Age Population:
Total Households:
Total Working Age Population:
Total Households:
Total Working Age Population:
Total Households: