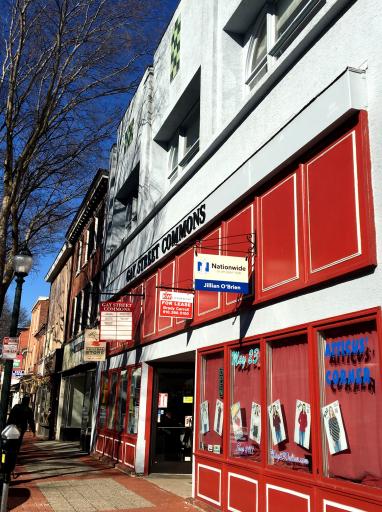
Office Space
117 West Gay Street West Chester, PA 19380
117 West Gay Street West Chester, PA 19380
Details & Description
Property Highlights
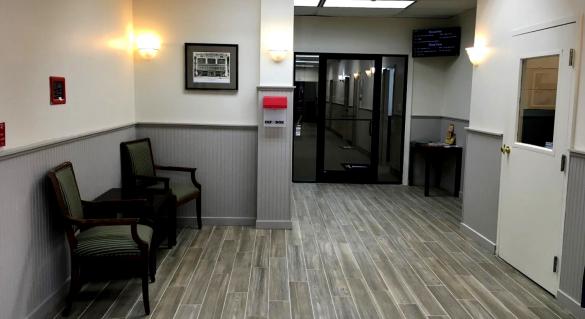
- • Elevator Serviced Building
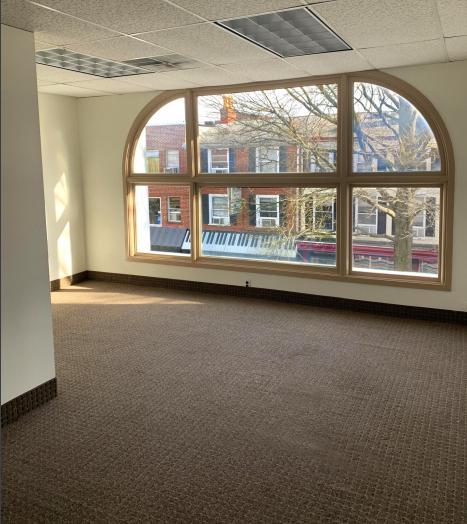
- • 3-Story Building with Ample Natural Light
- • Convenience Amenities Include
- • Coffee Grocery Store on 1st Floor of Building
- • Shared Conference Rooms
- • Self Storage Area in Lower Level
Additional Photos
Listing Agents

Andrew Turner
O: 484-887-8202
M: 484-888-1825
aturner@pillarrealestateadvisors.com
O: 484-887-8202
M: 484-888-1825
aturner@pillarrealestateadvisors.com
While we strive to provide the most accurate information, all listing information, and demographic data, is provided by third-parties. As such, MyEListing will not be responsible for the accuracy of the information. It is strongly recommended that you verify all information with the listing agent, and any relevant agencies, prior to making any decisions.


