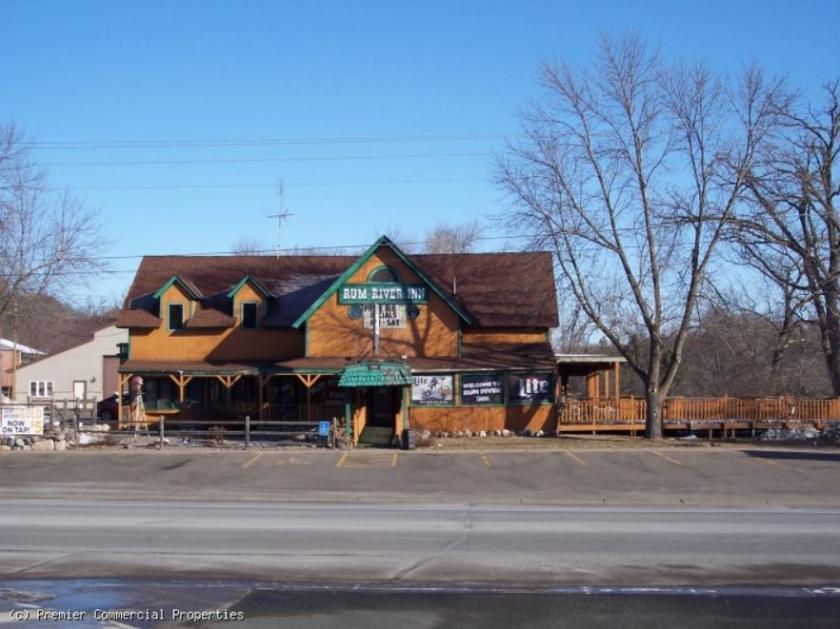
Retail Space
3631 Bridge Street Northwest Saint Francis, MN 55070
3631 Bridge Street Northwest Saint Francis, MN 55070
Details & Description
Property Highlights
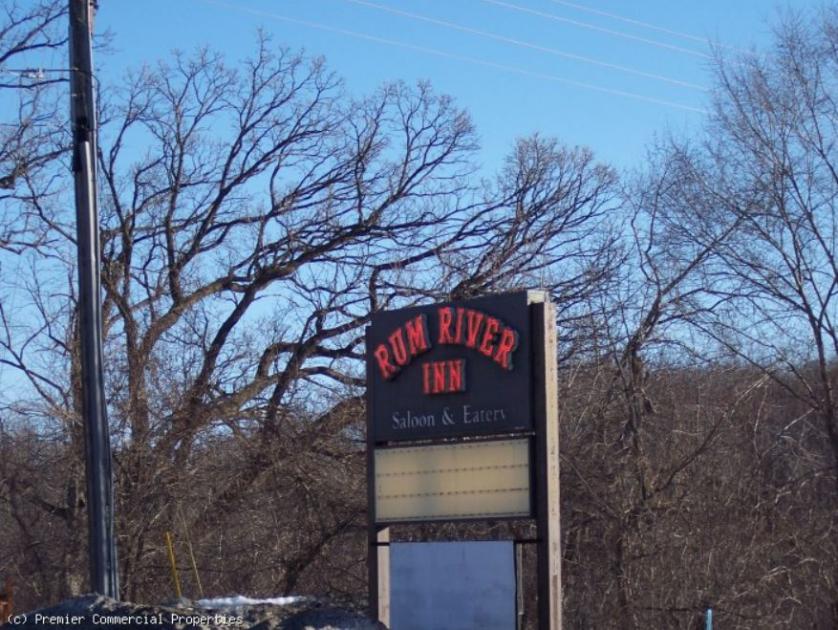
- • Full bar and restaurant
- • Property is on the historical register
- • Main Street St Francis, overlooking the Rum River
- • Inventory transferred at cost
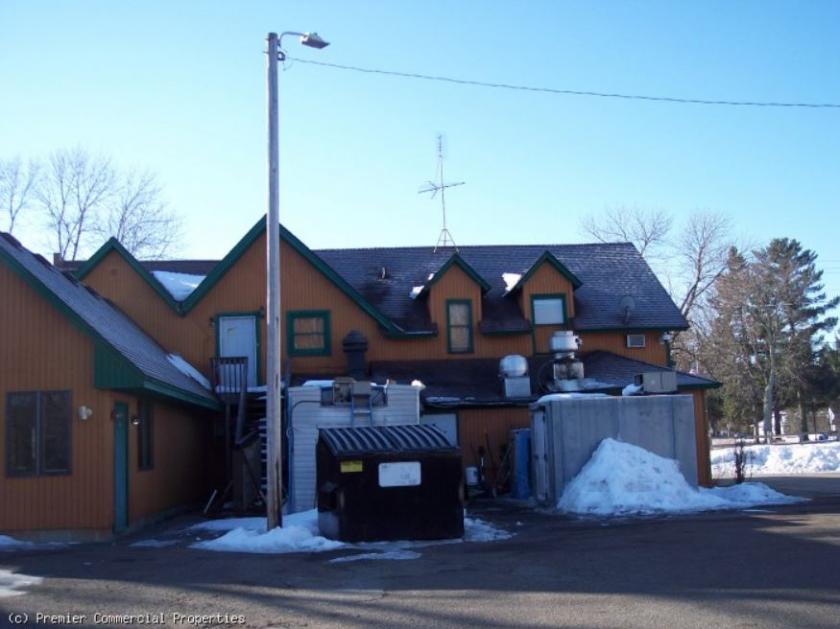
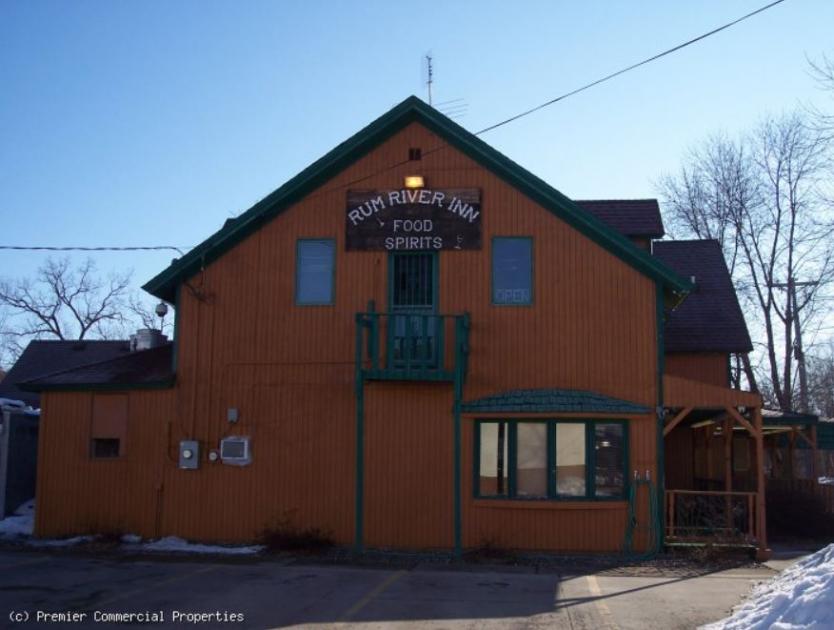
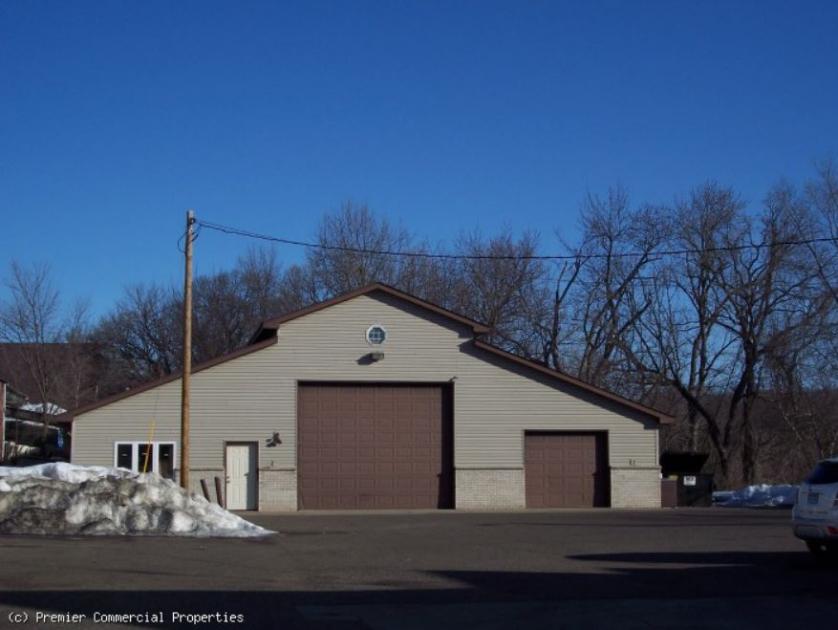
Additional Photos
Listing Agents

Marty Fisher
O: 763-862-2005
M: 612-708-2873
mfisher@premiercommercialproperties.com
O: 763-862-2005
M: 612-708-2873
mfisher@premiercommercialproperties.com
While we strive to provide the most accurate information, all listing information, and demographic data, is provided by third-parties. As such, MyEListing will not be responsible for the accuracy of the information. It is strongly recommended that you verify all information with the listing agent, and any relevant agencies, prior to making any decisions.


