Flex-Office-Warehouse
7230 ACC Boulevard Raleigh, NC 27617
7230 ACC Boulevard Raleigh, NC 27617
Details & Description
Property Highlights
- • Subdividable
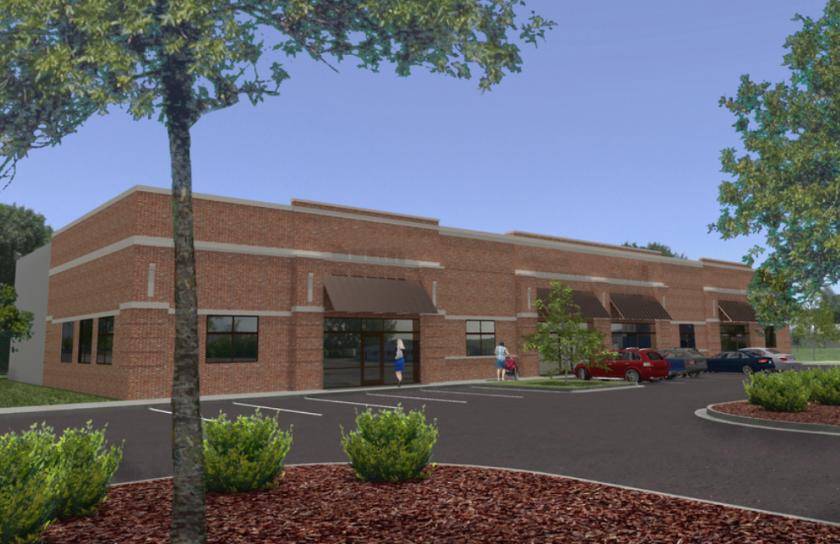
- • New construction
- • Delivery year end 2020
- • Approximately 15 office buildout
- • Brick and steel construction
- • 70 bay depths
Listing Agents

Jimmy Barnes
O: 919-714-7123
M: 919-210-5471
jbarnes@triprop.com
O: 919-714-7123
M: 919-210-5471
jbarnes@triprop.com
While we strive to provide the most accurate information, all listing information, and demographic data, is provided by third-parties. As such, MyEListing will not be responsible for the accuracy of the information. It is strongly recommended that you verify all information with the listing agent, and any relevant agencies, prior to making any decisions.


