Industrial Properties
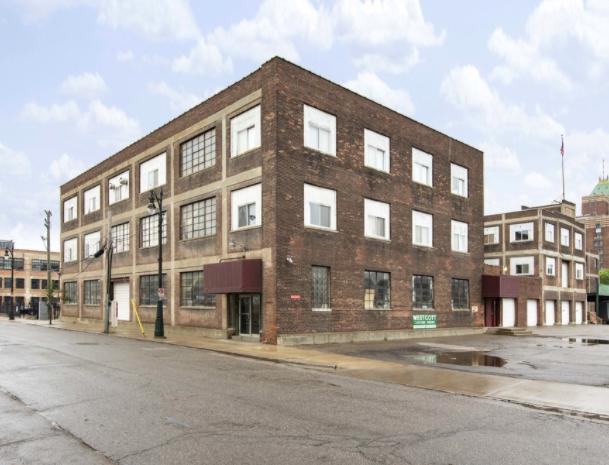
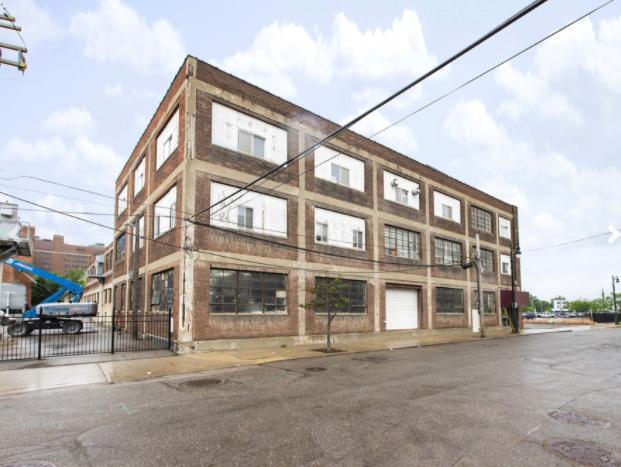
450 Amsterdam Street Detroit, MI 48202
450 Amsterdam Street Detroit, MI 48202
Details & Description
Property Highlights
- • Located in an Opportunity Zone
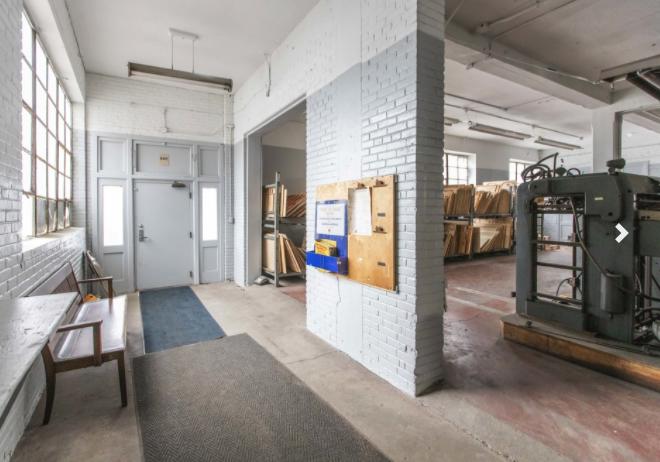
- • Midtown OfficeWarehouse Location
- • Ample Parking
- • Just off Woodward Ave on New Rail Line
- • Currently Operational
- • Walk to Qline
Additional Photos


Listing Agents
Daniel McCleary
O: 248-351-4384
M: 248-770-3969
mccleary@farbman.com
O: 248-351-4384
M: 248-770-3969
mccleary@farbman.com
While we strive to provide the most accurate information, all listing information, and demographic data, is provided by third-parties. As such, MyEListing will not be responsible for the accuracy of the information. It is strongly recommended that you verify all information with the listing agent, and any relevant agencies, prior to making any decisions.