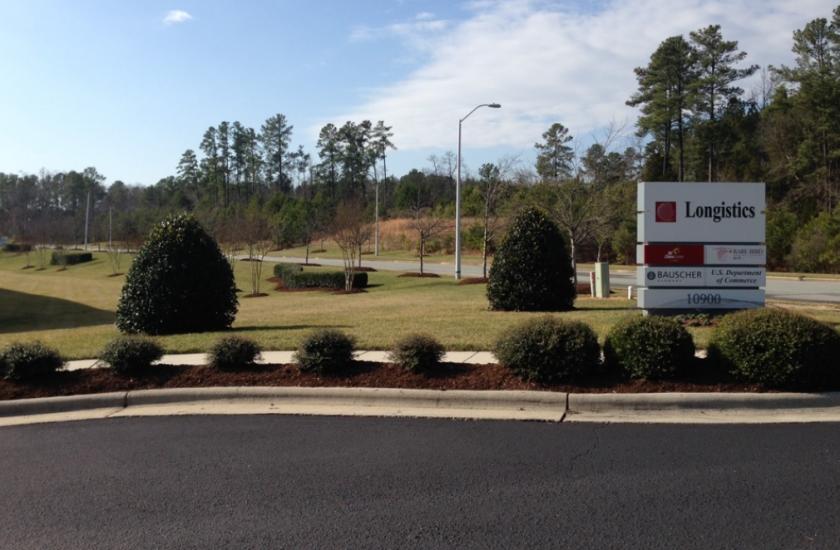
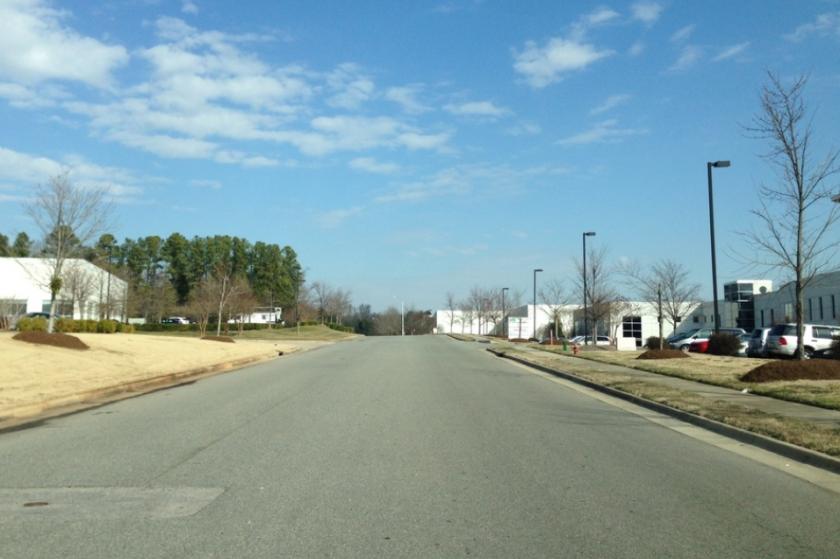
Commercial Land
World Trade Blvd Raleigh, NC 27617
World Trade Blvd Raleigh, NC 27617
Details & Description
Property Highlights
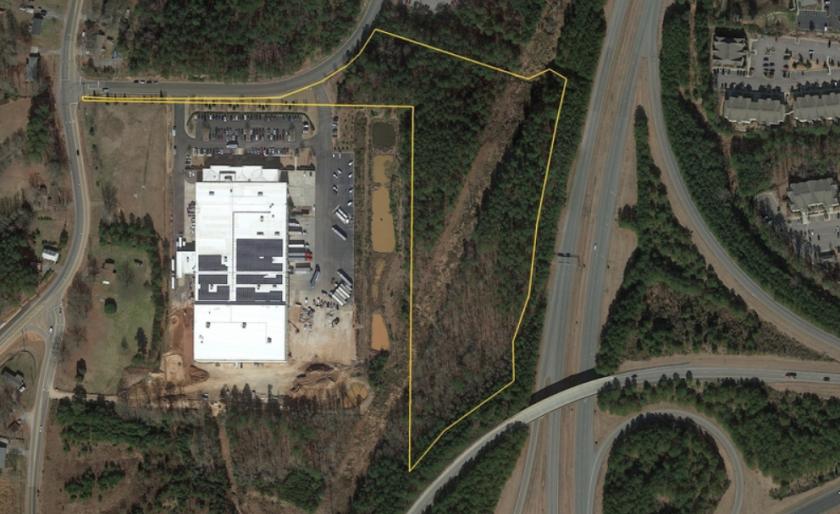
- • 11.1 acre parcel available
- • 1,500 feet of frontage along I-540
- • Located in Foreign Trade Zone 93
- • Zoned CUD-TD by the City of Raleigh
Listing Agents

Hunt Wyche
O: 919-714-7138
M: 919-740-4406
hwyche@triprop.com
O: 919-714-7138
M: 919-740-4406
hwyche@triprop.com
While we strive to provide the most accurate information, all listing information, and demographic data, is provided by third-parties. As such, MyEListing will not be responsible for the accuracy of the information. It is strongly recommended that you verify all information with the listing agent, and any relevant agencies, prior to making any decisions.