Retail Space
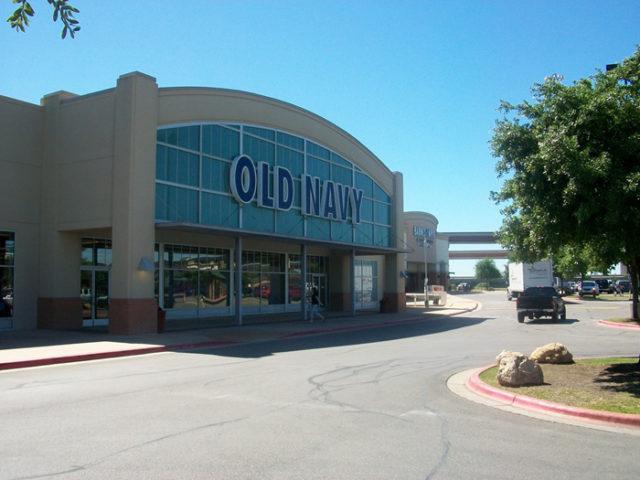
2601 La Frontera Boulevard Round Rock, TX 78681
2601 La Frontera Boulevard Round Rock, TX 78681

Details & Description
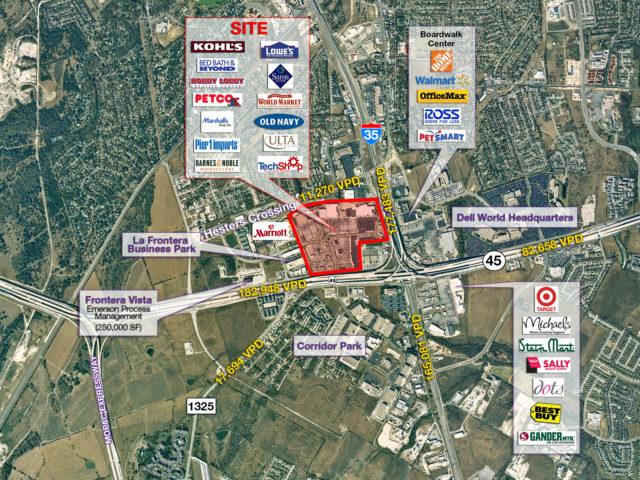
Property Highlights
• The new Apple campus development 7 miles to the southwest will add 5,000 employees
• Dell Technologies national headquarters employs over 158,000 directly across I-35
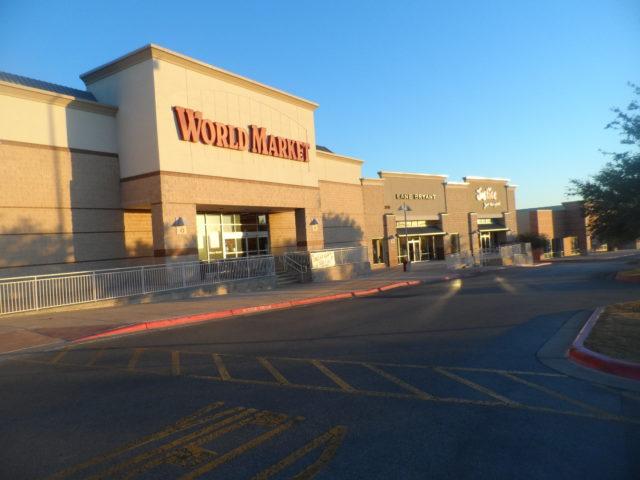
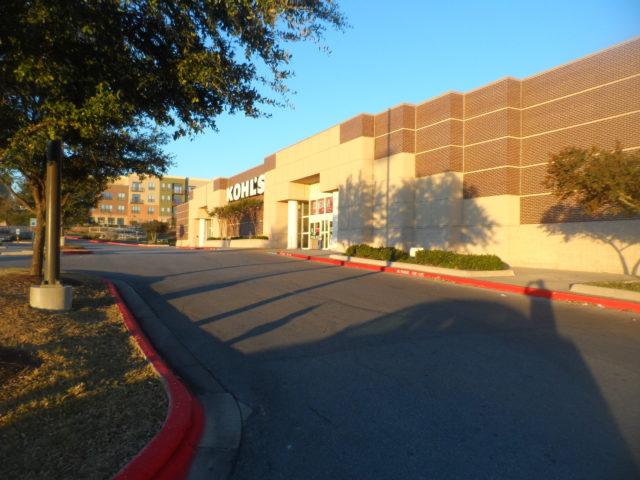
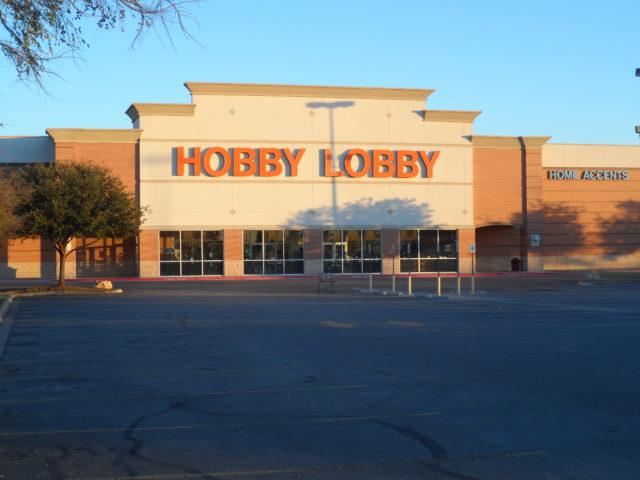
Additional Photos
Listing Agents

Dan Gostylo
M: 210-601-1919
dan.gostylo@partnersrealestate.com
M: 210-601-1919
dan.gostylo@partnersrealestate.com
While we strive to provide the most accurate information, all listing information, and demographic data, is provided by third-parties. As such, MyEListing will not be responsible for the accuracy of the information. It is strongly recommended that you verify all information with the listing agent, and any relevant agencies, prior to making any decisions.