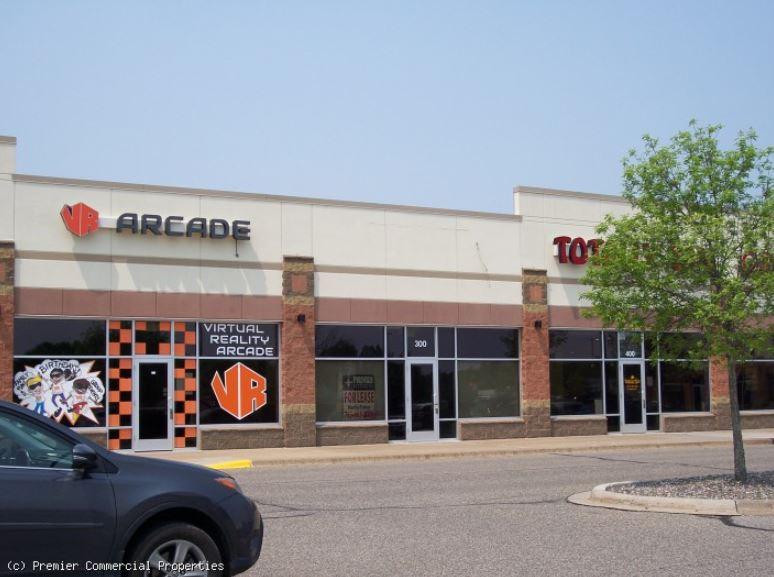
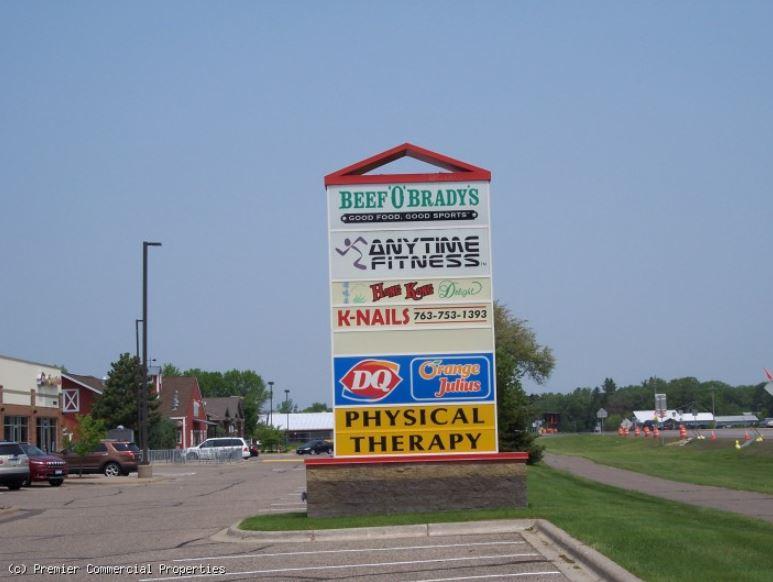
1-Mile | 3-Miles | 5-Miles | ||
---|---|---|---|---|
Total Population | 1,268 | 7,870 | 16,904 | |
Population Median Age | 33 | 35 | 36 | |
Population by Age | 0-9 Yrs | 218 (17%) | 1287 (16%) | 2599 (15%) |
10-19 Yrs | 167 (13%) | 1043 (13%) | 2279 (13%) | |
20-29 Yrs | 183 (14%) | 923 (11%) | 1894 (11%) | |
30-39 Yrs | 236 (18%) | 1225 (15%) | 2395 (14%) | |
40-49 Yrs | 155 (12%) | 1090 (13%) | 2355 (13%) | |
50-59 Yrs | 192 (15%) | 1172 (14%) | 2644 (15%) | |
60-69 Yrs | 57 (4%) | 643 (8%) | 1579 (9%) | |
70+ Yrs | 60 (4%) | 486 (6%) | 1158 (6%) | |
Median HH Income | $78,115 | $90,897 | $93,455 | |
Total Household Income | < 24K | 48 (11%) | 209 (7%) | 409 (7%) |
25-49K | 59 (13%) | 323 (12%) | 704 (12%) | |
50-74K | 96 (22%) | 435 (16%) | 912 (15%) | |
75-99K | 111 (25%) | 560 (21%) | 1142 (19%) | |
100-199K | 110 (25%) | 973 (36%) | 2224 (38%) | |
200K+ | 9 (2%) | 146 (5%) | 345 (6%) | |
Highest Education Level | No Diploma | 72 | 334 | 681 |
Diploma or GED | 336 | 1775 | 3656 | |
Some College | 175 | 1227 | 2748 | |
Assoc. Degree | 90 | 669 | 1519 | |
Bachelors Degree | 84 | 763 | 1800 | |
Higher Degree | 25 | 310 | 698 | |
Total Housing Units | 476 | 2,764 | 5,929 | |
--Owner-Occupied | 354 | 2,366 | 5,248 | |
--Renter-Occupied | 79 | 280 | 488 | |
Owner-Occupied Values | < 100K | 27 | 148 | 295 |
100-199K | 143 | 595 | 1174 | |
200-299K | 145 | 926 | 2073 | |
300-399K | 29 | 491 | 1147 | |
400-499K | 4 | 105 | 324 | |
500K+ | 6 | 101 | 235 | |
Total Working Age Population | 921 | 5,875 | 12,801 | |
In Work Force | 714 | 4,460 | 9,606 | |
Not In Work Force | 207 | 1,415 | 3,195 | |
Workforce Employed | 678 | 4,319 | 9,329 | |
Workforce Unemployed | 36 | 141 | 274 | |
Civlian Workforce | 714 | 4,459 | 9,603 | |
Military Workforce | 0 | 1 | 3 | |
Total Households | 432 | 2,647 | 5,737 | |
Family Households | 316 | 2,027 | 4,434 | |
Non-Family Households | 116 | 619 | 1,302 | |
Married Couple | 217 | 1,592 | 3,562 | |
Other Family | 99 | 435 | 872 | |
Married w/Child | 123 | 714 | 1,481 | |
Single Male w/Child | 16 | 97 | 233 | |
Single Female w/Child | 34 | 133 | 244 |
Population Change Last Two Decades - Plus Projection
2000 | % | 2010 | % | 2020 | % | 2030 | |
---|---|---|---|---|---|---|---|
Minnesota | 4,919,479 | +8 | 5,303,925 | +7 | 5,687,161 | +5 | 5,974,304 |
Anoka County | 298,084 | +11 | 330,844 | +8 | 358,469 | +6 | 380,651 |
Isanti County | 31,287 | +21 | 37,816 | +5 | 39,570 | +2 | 40,345 |
Total Working Age Population:
Total Households:
Total Working Age Population:
Total Households:
Total Working Age Population:
Total Households: