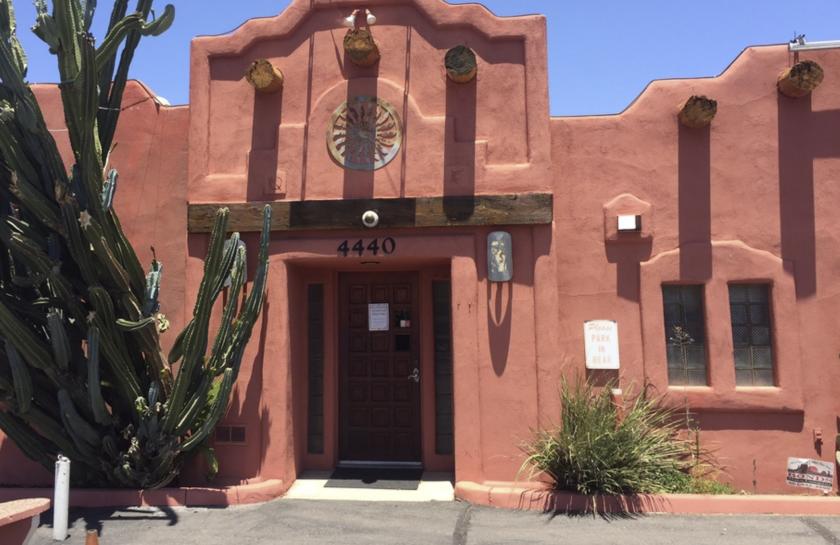
Retail Space
4440 East Indian School Road Phoenix, AZ 85018
4440 East Indian School Road Phoenix, AZ 85018
Details & Description
Property Highlights
• Walking distance to local and national restaurant and retail including Doughbird, Smashburger, Sushi Brokers
• Rare Indian School Road frontage for sale in growing Phoenix neighborhood of Arcadia
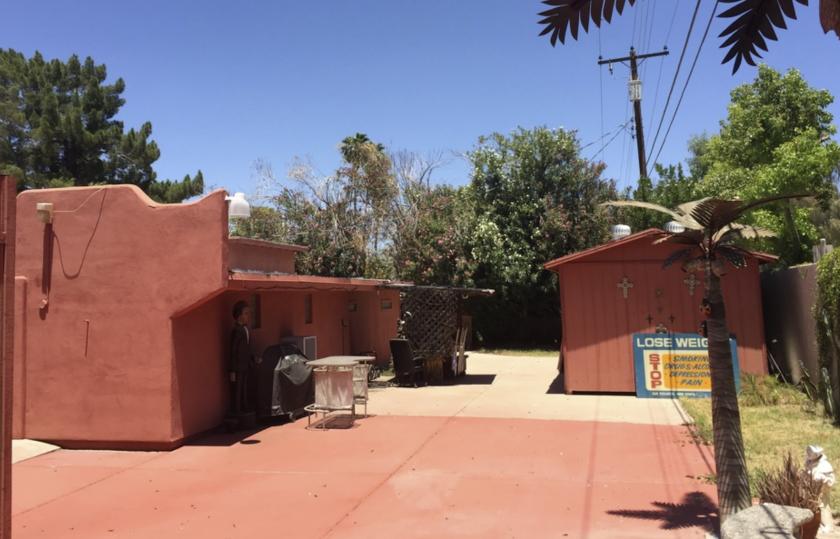
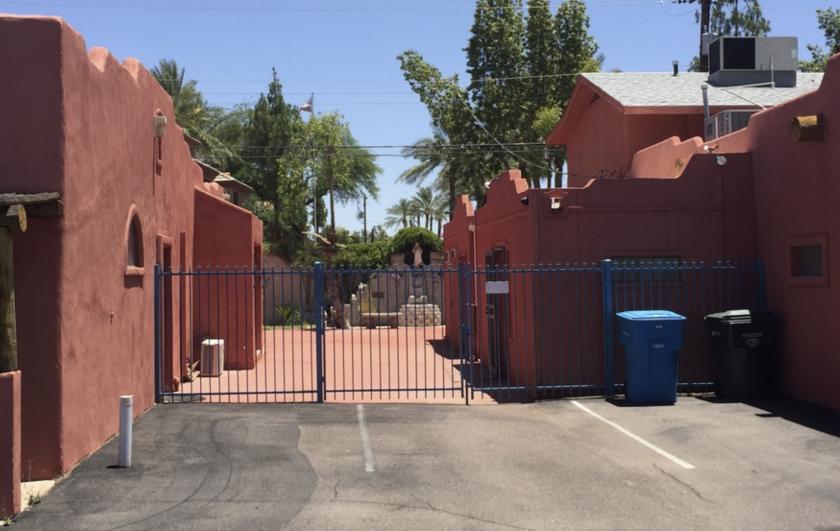
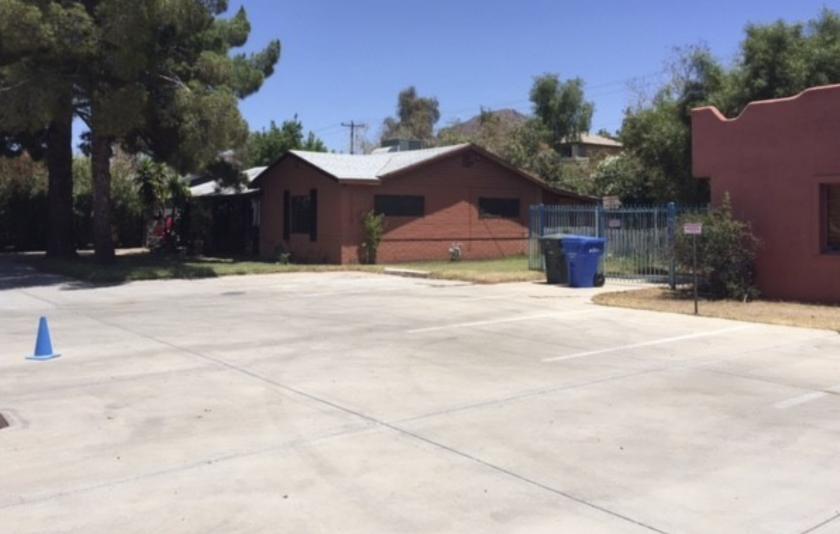
Additional Photos
Listing Agents

Sean Lieb
O: 602-491-9295
M: 602-376-9797
slieb@levrose.com
O: 602-491-9295
M: 602-376-9797
slieb@levrose.com
While we strive to provide the most accurate information, all listing information, and demographic data, is provided by third-parties. As such, MyEListing will not be responsible for the accuracy of the information. It is strongly recommended that you verify all information with the listing agent, and any relevant agencies, prior to making any decisions.


