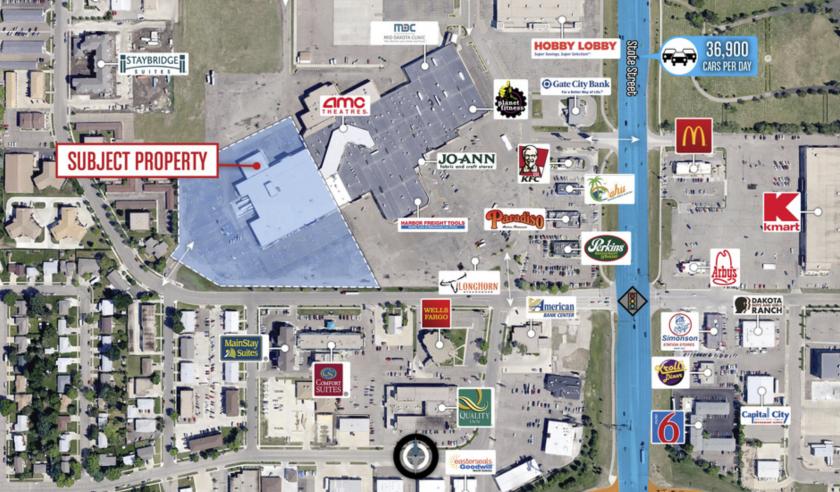
1-Mile | 3-Miles | 5-Miles | ||
---|---|---|---|---|
Total Population | 11,130 | 57,031 | 79,848 | |
Population Median Age | 41 | 40 | 39 | |
Population by Age | 0-9 Yrs | 1423 (12%) | 6809 (11%) | 9994 (12%) |
10-19 Yrs | 1176 (10%) | 6409 (11%) | 8994 (11%) | |
20-29 Yrs | 1644 (14%) | 8816 (15%) | 11879 (14%) | |
30-39 Yrs | 1207 (10%) | 7591 (13%) | 11122 (13%) | |
40-49 Yrs | 1186 (10%) | 6055 (10%) | 8648 (10%) | |
50-59 Yrs | 1360 (12%) | 6973 (12%) | 10395 (13%) | |
60-69 Yrs | 1442 (12%) | 6808 (11%) | 9400 (11%) | |
70+ Yrs | 1691 (15%) | 7570 (13%) | 9417 (11%) | |
Median HH Income | $57,353 | $60,348 | $65,340 | |
Total Household Income | < 24K | 1082 (19%) | 4931 (19%) | 6019 (17%) |
25-49K | 1327 (24%) | 5813 (22%) | 7535 (21%) | |
50-74K | 1141 (20%) | 4861 (18%) | 6495 (18%) | |
75-99K | 633 (11%) | 3082 (11%) | 4449 (12%) | |
100-199K | 1159 (21%) | 5820 (22%) | 8802 (25%) | |
200K+ | 120 (2%) | 1224 (4%) | 1907 (5%) | |
Highest Education Level | No Diploma | 436 | 2529 | 3514 |
Diploma or GED | 2168 | 9681 | 13178 | |
Some College | 1645 | 8305 | 11823 | |
Assoc. Degree | 924 | 5449 | 7786 | |
Bachelors Degree | 1924 | 9904 | 13968 | |
Higher Degree | 650 | 3627 | 5103 | |
Total Housing Units | 5,819 | 27,978 | 38,267 | |
--Owner-Occupied | 3,139 | 15,123 | 22,408 | |
--Renter-Occupied | 2,323 | 10,608 | 12,799 | |
Owner-Occupied Values | < 100K | 248 | 1300 | 2715 |
100-199K | 905 | 3494 | 4360 | |
200-299K | 1489 | 5837 | 8046 | |
300-399K | 388 | 2825 | 4449 | |
400-499K | 64 | 895 | 1501 | |
500K+ | 45 | 773 | 1336 | |
Total Working Age Population | 9,033 | 46,430 | 64,555 | |
In Work Force | 5,912 | 31,270 | 44,667 | |
Not In Work Force | 3,121 | 15,160 | 19,888 | |
Workforce Employed | 5,827 | 30,409 | 43,439 | |
Workforce Unemployed | 83 | 739 | 1,030 | |
Civlian Workforce | 5,910 | 31,148 | 44,469 | |
Military Workforce | 2 | 122 | 198 | |
Total Households | 5,463 | 25,731 | 35,207 | |
Family Households | 3,010 | 14,208 | 20,512 | |
Non-Family Households | 2,453 | 11,523 | 14,696 | |
Married Couple | 2,107 | 10,765 | 15,940 | |
Other Family | 903 | 3,443 | 4,572 | |
Married w/Child | 689 | 3,900 | 6,029 | |
Single Male w/Child | 132 | 611 | 877 | |
Single Female w/Child | 524 | 1,780 | 2,308 |
Population Change Last Two Decades - Plus Projection
2000 | % | 2010 | % | 2020 | % | 2030 | |
---|---|---|---|---|---|---|---|
North Dakota | 642,200 | +5 | 672,591 | +23 | 824,344 | +13 | 931,506 |
Burleigh County | 69,416 | +17 | 81,308 | +24 | 100,986 | +10 | 110,932 |
Morton County | 25,303 | +9 | 27,471 | +19 | 32,712 | +10 | 36,006 |
Total Working Age Population:
Total Households:
Total Working Age Population:
Total Households:
Total Working Age Population:
Total Households: