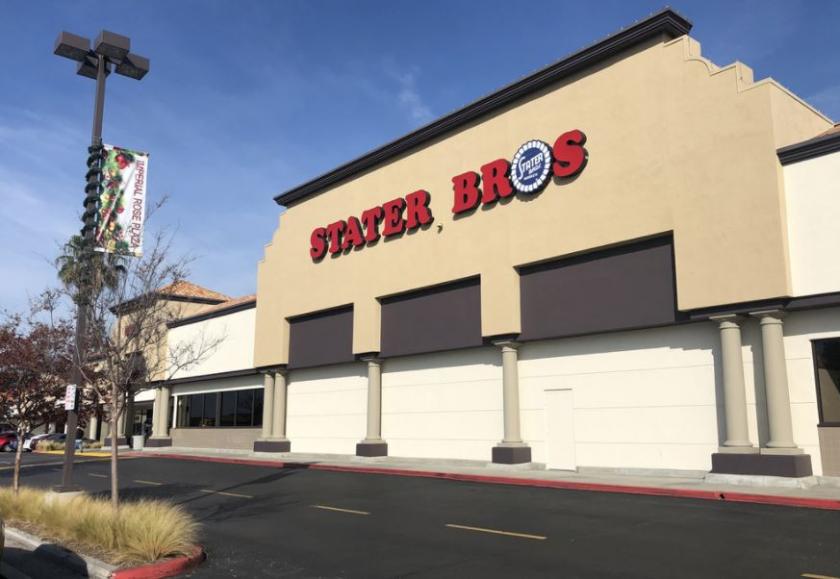
Retail Space
1001 East Imperial Highway Placentia, CA 92870
1001 East Imperial Highway Placentia, CA 92870
Details & Description
Property Highlights
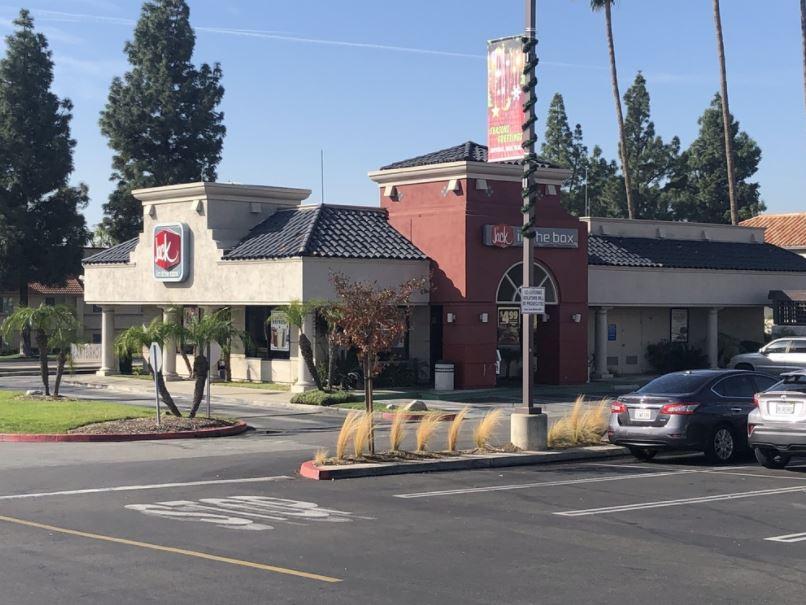
• Convenient access from signalized intersection with multiple ingress egress points
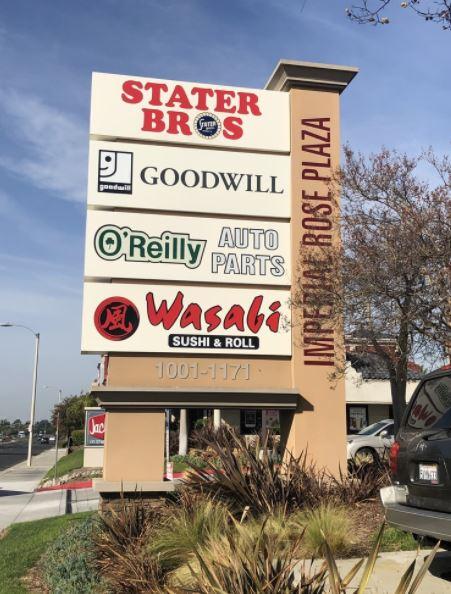
• Monument signage available along Imperial Hwy and Rose Drive
Additional Photos


Listing Agents

Matt Hammond
O: 714-210-6711
mhammond@coreland.com
O: 714-210-6711
mhammond@coreland.com
While we strive to provide the most accurate information, all listing information, and demographic data, is provided by third-parties. As such, MyEListing will not be responsible for the accuracy of the information. It is strongly recommended that you verify all information with the listing agent, and any relevant agencies, prior to making any decisions.


