Retail Space
720 North Brea Boulevard Brea, CA 92821
720 North Brea Boulevard Brea, CA 92821
Details & Description
Property Highlights
• Located at intersection of Brea Boulevard and State College Boulevard with excellent ingressegress
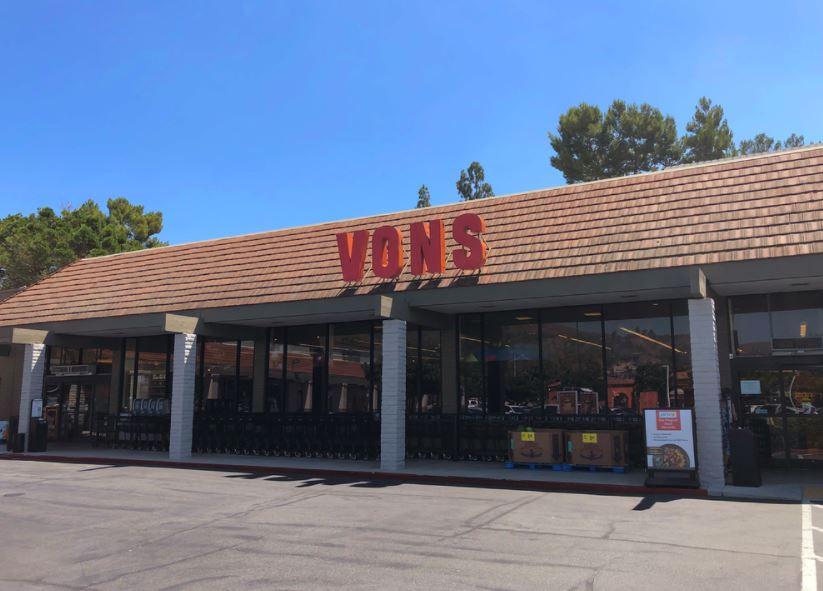
• Vons-anchored neighborhood center in strong, mature trade area
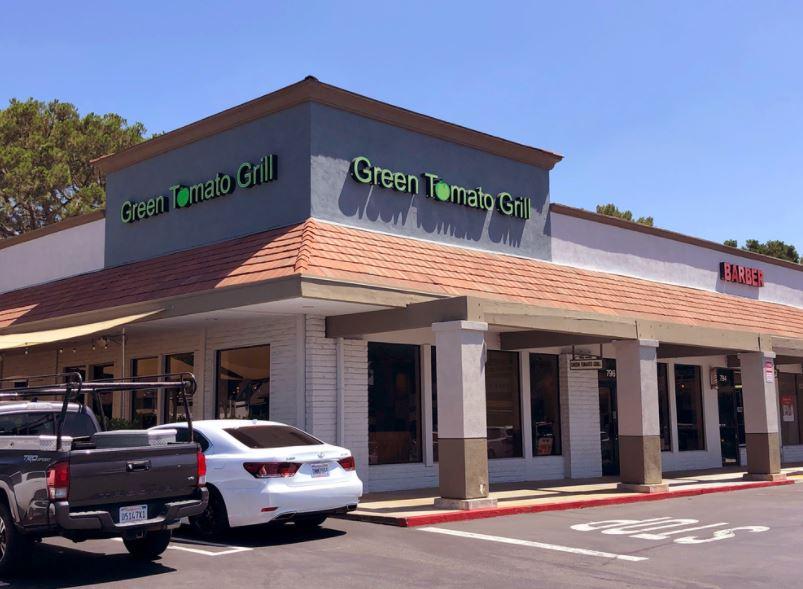
Additional Photos


Listing Agents

Matt Hammond
O: 714-210-6711
mhammond@coreland.com
O: 714-210-6711
mhammond@coreland.com
While we strive to provide the most accurate information, all listing information, and demographic data, is provided by third-parties. As such, MyEListing will not be responsible for the accuracy of the information. It is strongly recommended that you verify all information with the listing agent, and any relevant agencies, prior to making any decisions.


